Power BI Dashboard Development Services and Solutions
Data Organization and Presentation gets upgraded with our efficient and powerful Power BI Dashboards. Find More Insights in Less Time, Everything at a Single Place.
Our Esteemed Clientele


By collaborating with the Power BI Dashboard Development services, your organization could get one step closer to the future. Leading businesses recognize our expertise with Power BI as AI managed Data services are currently strongly advised for enhanced efficiency.
Proven Experts in Power BI Development
By collaborating with the Power BI Dashboard Development services, your organization could get one step closer to the future. Leading businesses recognize our expertise with Power BI as AI managed Data services are currently strongly advised for enhanced efficiency.
Partnership
Sunflower Lab has achieved a significant milestone by becoming a recognized consulting partner by Microsoft and with Azure Databricks, a leading analytics and machine learning platform. This collaboration combines advanced analytics with Azure Power BI for data-driven decision-making, operational efficiency, and improved competitiveness, fueling business growth and success.
Powering up the Visualization of Business Data
With Power BI Dashboards your business data will get the ultimate makeover for improved visual impact and important data’s ease of access.
Know KPIs Better
Executives can more effectively understand KPIs (Key performance indicators) by using Power BI interactive dashboards.

Using NLP with BI
Ask queries using NLP (Natural Language Processing), quickly locate the answers, and then integrate the results into Power BI charts and graphs.

Predictive Analysis
Power BI dashboards can be used to make data-driven decisions. In addition, analytics technologies can be utilized to gain an accurate depiction of present business developments.

Mobile Access
Collaborate with your organization by connecting to M365 or other external options. Every time you need to access statistics, check them on your device.
Power BI Dashboards for Persistent KPI Analysis on a modern Medical Application
Using RPA to manage claims, analyze a great deal of data, and automate electronic medical records. Better patient history recording results in better diagnoses and healthcare administration. All these data are presented efficiently with the help of Power BI Data Visualization
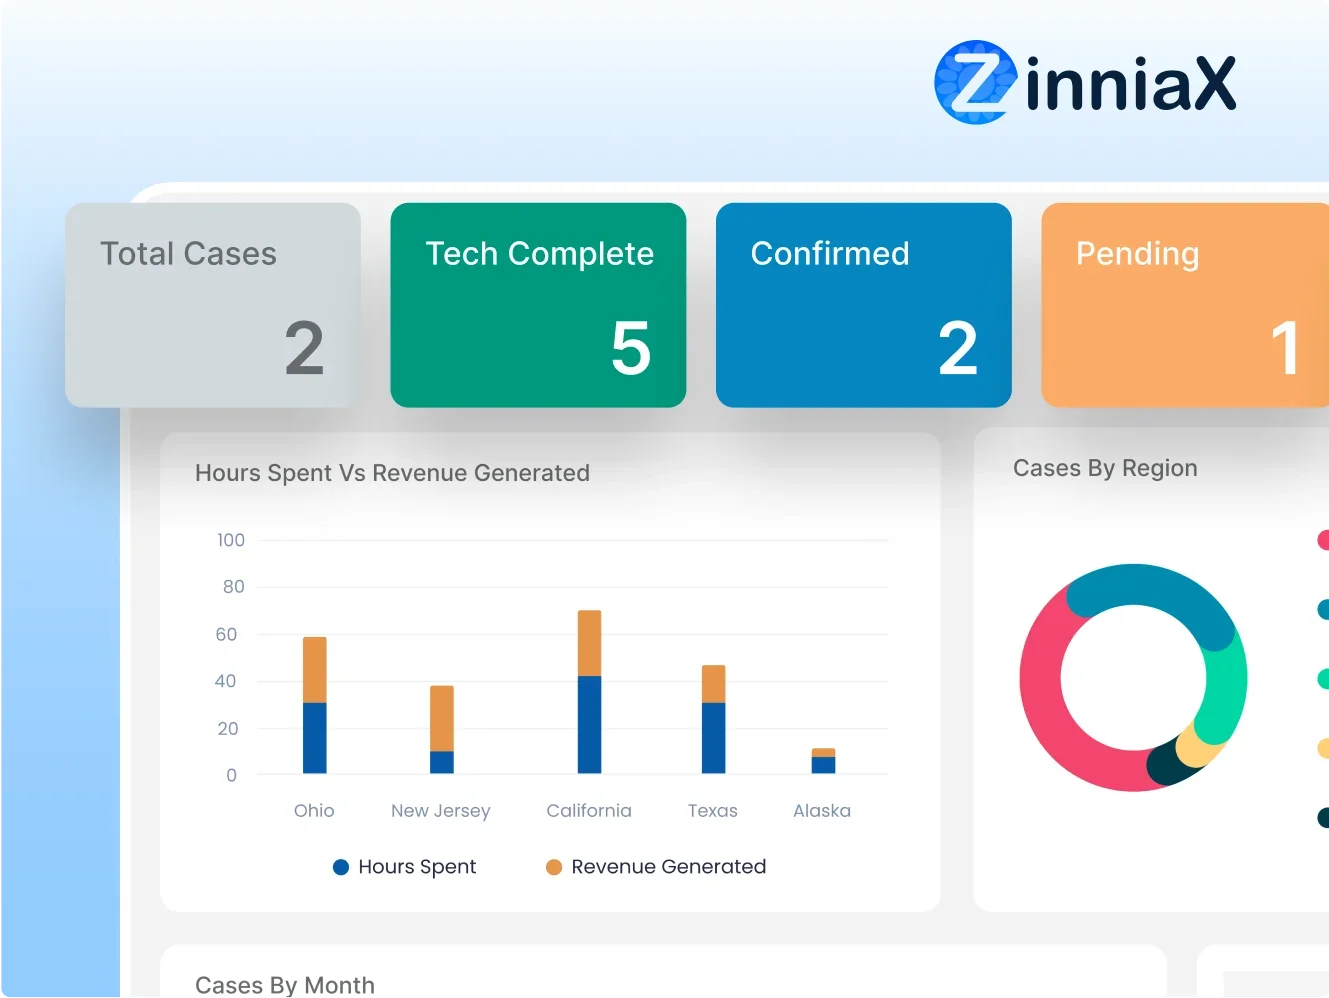
 Case Study - Zinniax
Striking Features of Power BI Dashboards

Effortless to Use
You don’t need to generate a single line of code while using the Power BI dashboard. All you need to do is understand how to use an intelligent tool that already has a user interface in it and add the necessary reporting features that are compatible with your needs.

No-Code Formula
The learning curve for building Power BI dashboards gets shorter since there is no coding essential, and it is easy to use. Even if you are unfamiliar with MS Office apps, using the Power BI dashboard won’t be challenging.

Customizable Interface
It could be a Power BI sales dashboard or a Power BI financial dashboard, you could customize the interface for your organization’s needs. For a more seamless experience, integrate the Power BI dashboard into the website or application.

Cost Efficient
With Power BI data visualization, you can build interactive dashboards and reports without investing anything. Power BI desktop is a free desktop version of the program. If you want to add additional features, you may shell out for them.

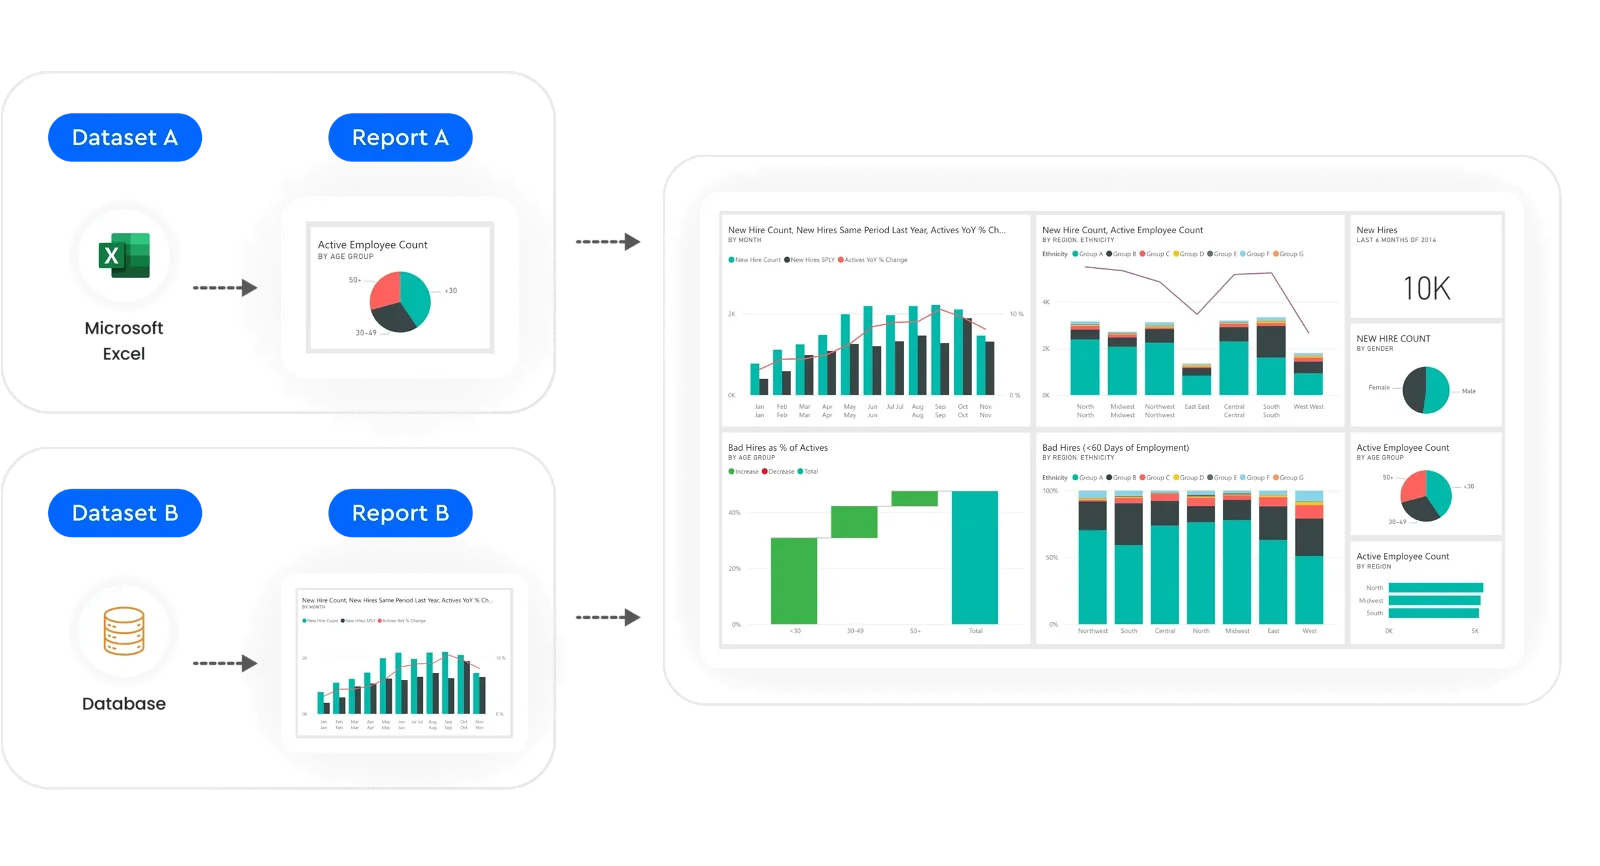
Multiple Data Sourcing
The tool aids in the analysis of data from multiple sources. Almost any data source, including Microsoft Excel, MySQL, Salesforce, Azure SQL, data warehouses, and more, can be obtained with Power BI.

Q&A Capabilities
This function has the immense advantage of enabling you to ask inquiries in conventional language and giving you the responses, you desire. You only need to go to the Q&A section and register your query.
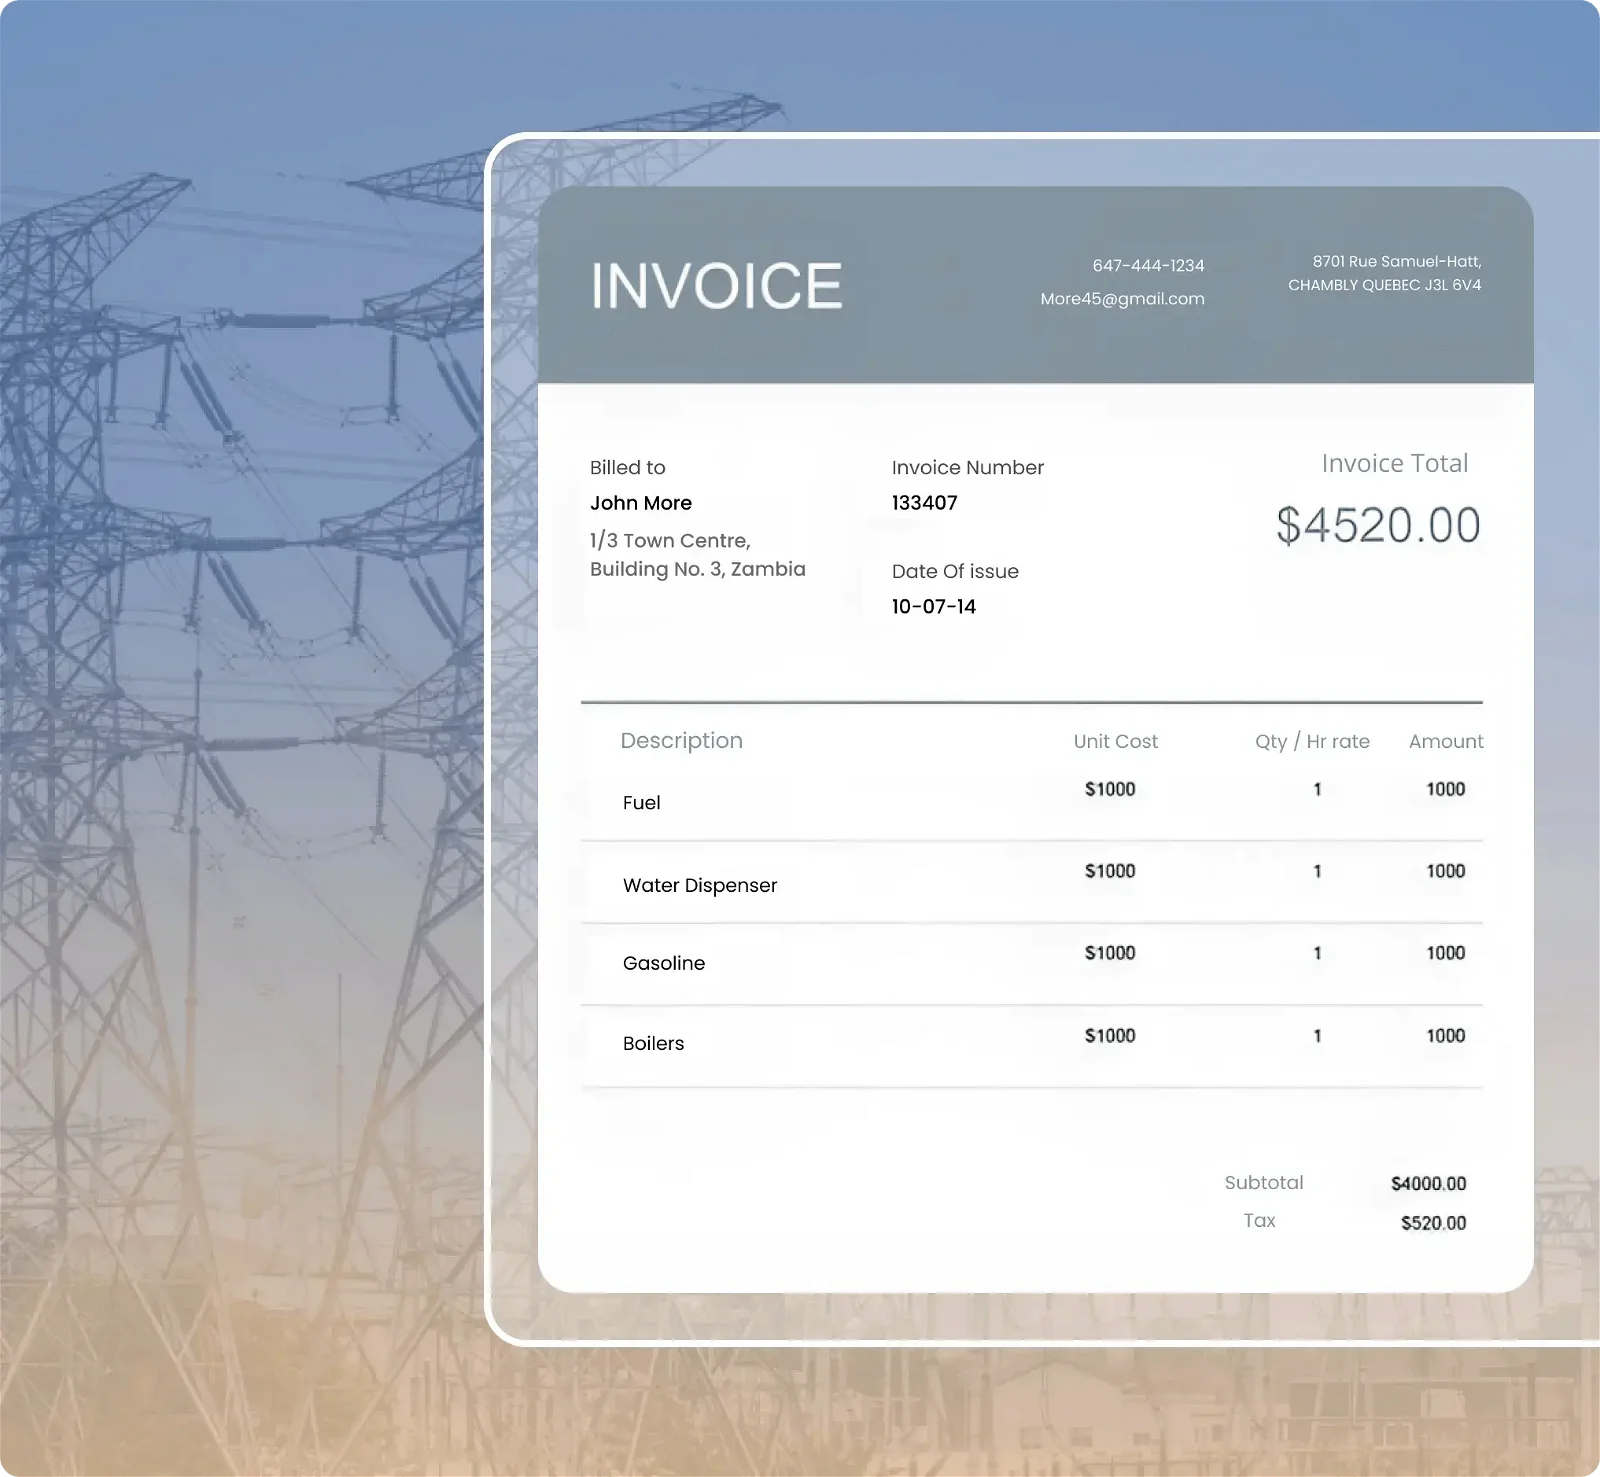
Fostering Power BI Dashboards in Energy Industry
Use Case – Energy Providers
You can incorporate meter inventories, readings, and customer billing by using intelligent dashboards. Analyze abnormal consumption trends and meter alerts as well.
Dashboards to Meet Your Exact Needs

Dashboards for HR
Make dashboards for your company’s HR needs

Executive Dashboards
Get Swift data with Executive dashboards for your business

Dashboards for Sales Need
Get Power BI sales dashboard for better sales rate

Financial Dashboards
With Power BI financial dashboard, make swift financial decisions

Manufacturing Dashboards
View all your manufacturing data at a consolidated place with Power BI dashboard
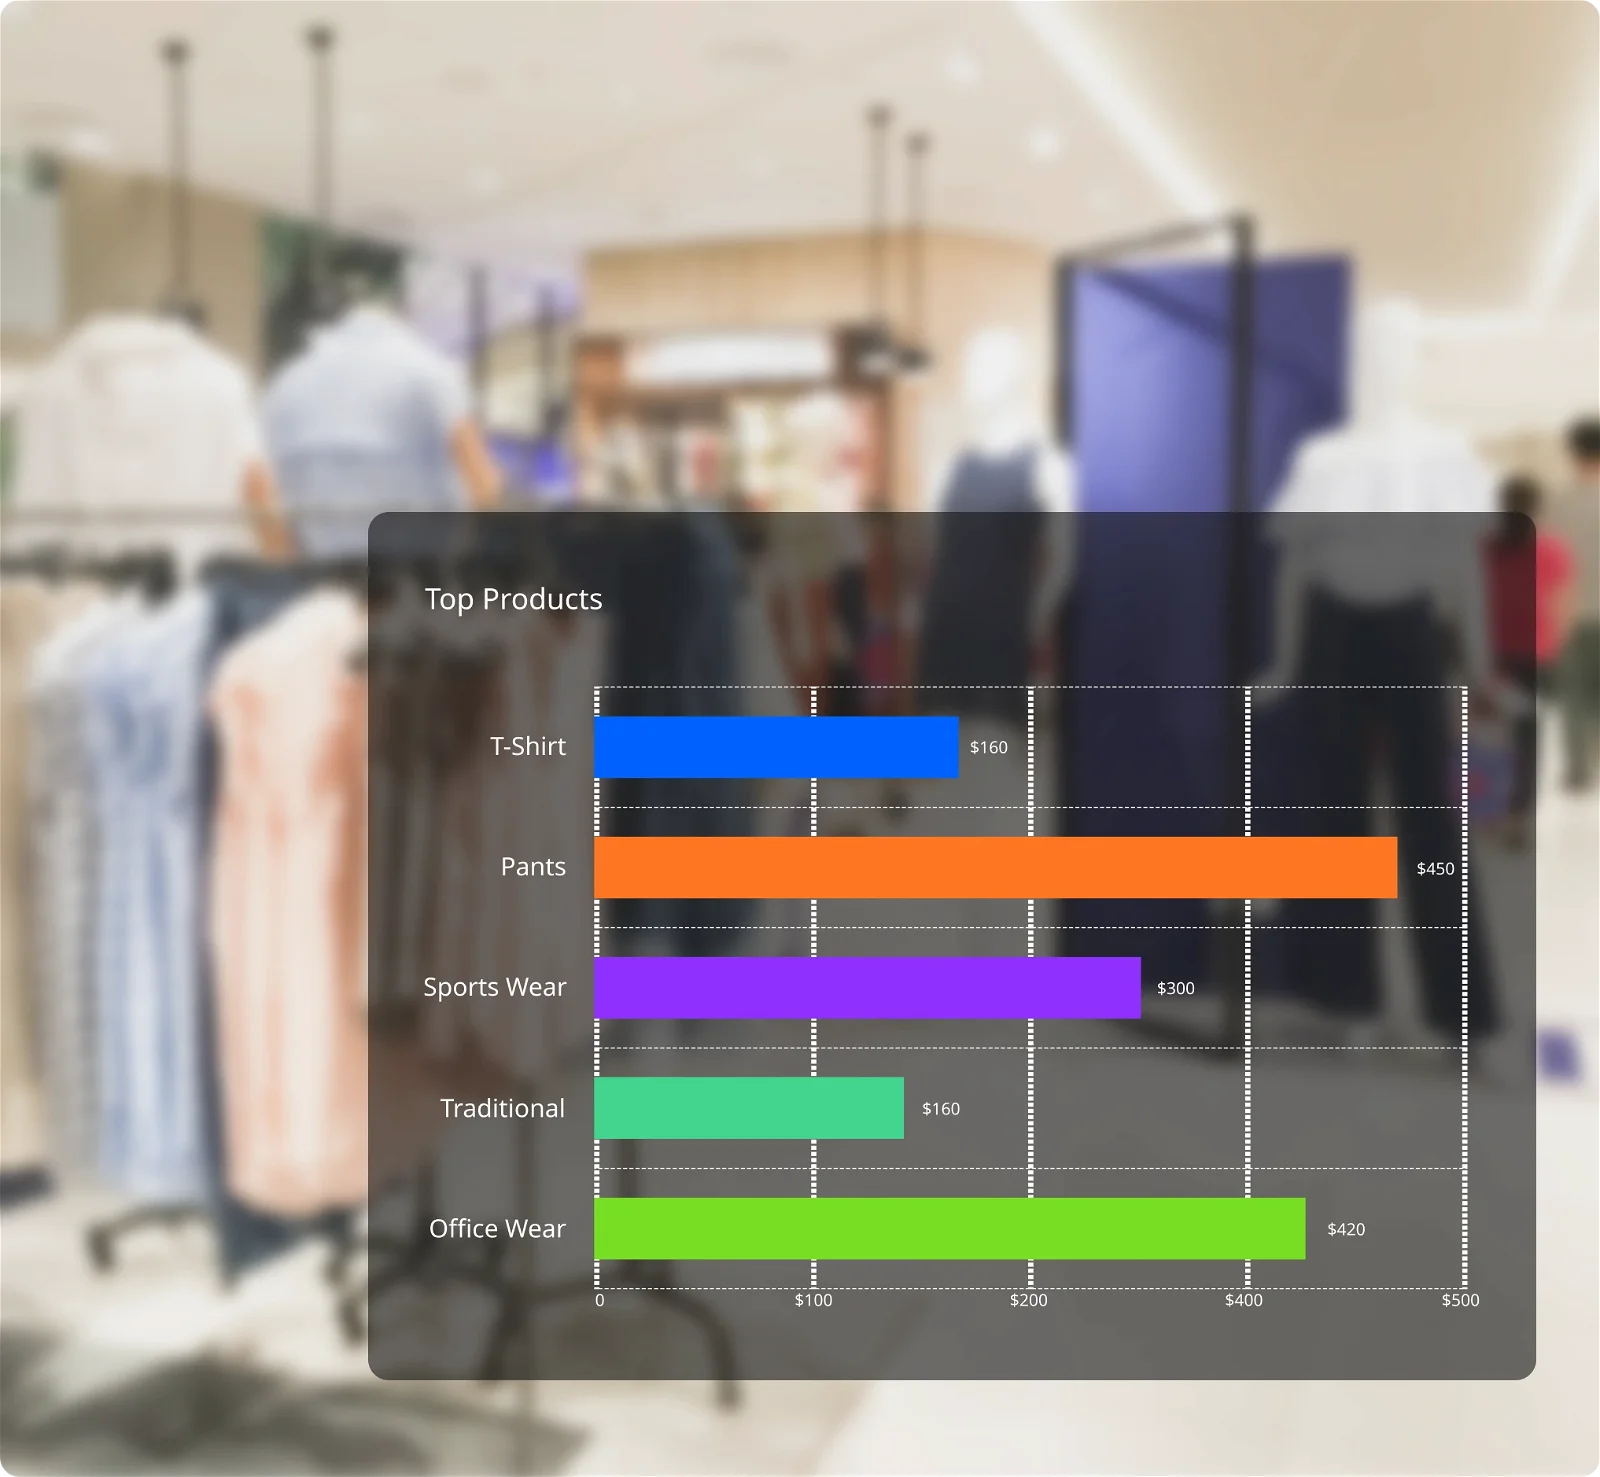
Boost Retail Growth with Power BI Dashboards
Industry-specific Power BI dashboard solutions for the retail sector include inventory updates, stock report creation, cashflow insights, warehouse and seller updates, and more.
Use Case - Retail
"Although Sunflower Lab is still working on the project, they establish a coherent roadmap for the engagement. The team maintains a strong understanding of the business, which allows them to create effective solutions. “
Gene Boucher
Zinniax
testimonials

Upgrading Medical Care with Dashboards
Use Case – Healthcare
With Power BI dashboard services, you could possibly get a number of upgrades, such as resource optimization, insights from medical data, and tracking patient testing/demands.


Power BI Dashboards Modernizing Manufacturing
For guidance automating and releasing paginated reports, categorizing important reports, production assessment, trend data, and more, get in touch with our Power BI experts right away.
Use Case - Manufacturing
Explore Our More Capabilities
Teams & Achievements
15+
Years Of Experience
250+
Projects Completed
96%
Customer Retention
150+
Team Strength
Your Go-To Resource For Answers & Insights
Organizations can gain a real-time picture of their data as it arrives thanks to Power BI’s support for real-time data streaming and visualization. Users using Power BI can build real-time dashboards that refresh instantly as new data is received because of real-time data streaming.
You can get data from the Home ribbon to integrate data and then the window for “Get Data” appears. Power BI Desktop can link to a wide variety of data sources, which you can select from. Use the Excel workbook that you got from Prerequisites for this quick start.
Some of the basic visualizations available in Power BI are Area Charts, Bar & Column charts, Combo charts, Doughnut charts, Funnel charts, Guage charts, KPIs and even Maps can be displayed. These visualizations are usually prepared in reports and pinned on the dashboards.
With Power BI Dashboards, you get to Make documentation for reports and dashboards, work together, share, and incorporate documentation from different products, learn more about Power BI, identify report topics, add conditional formatting to tables, Learn How to distribute your work, Set up the new workplaces for work.
From Ideation To Support, We Partner With You All The Way
Contact our team of experts today!

