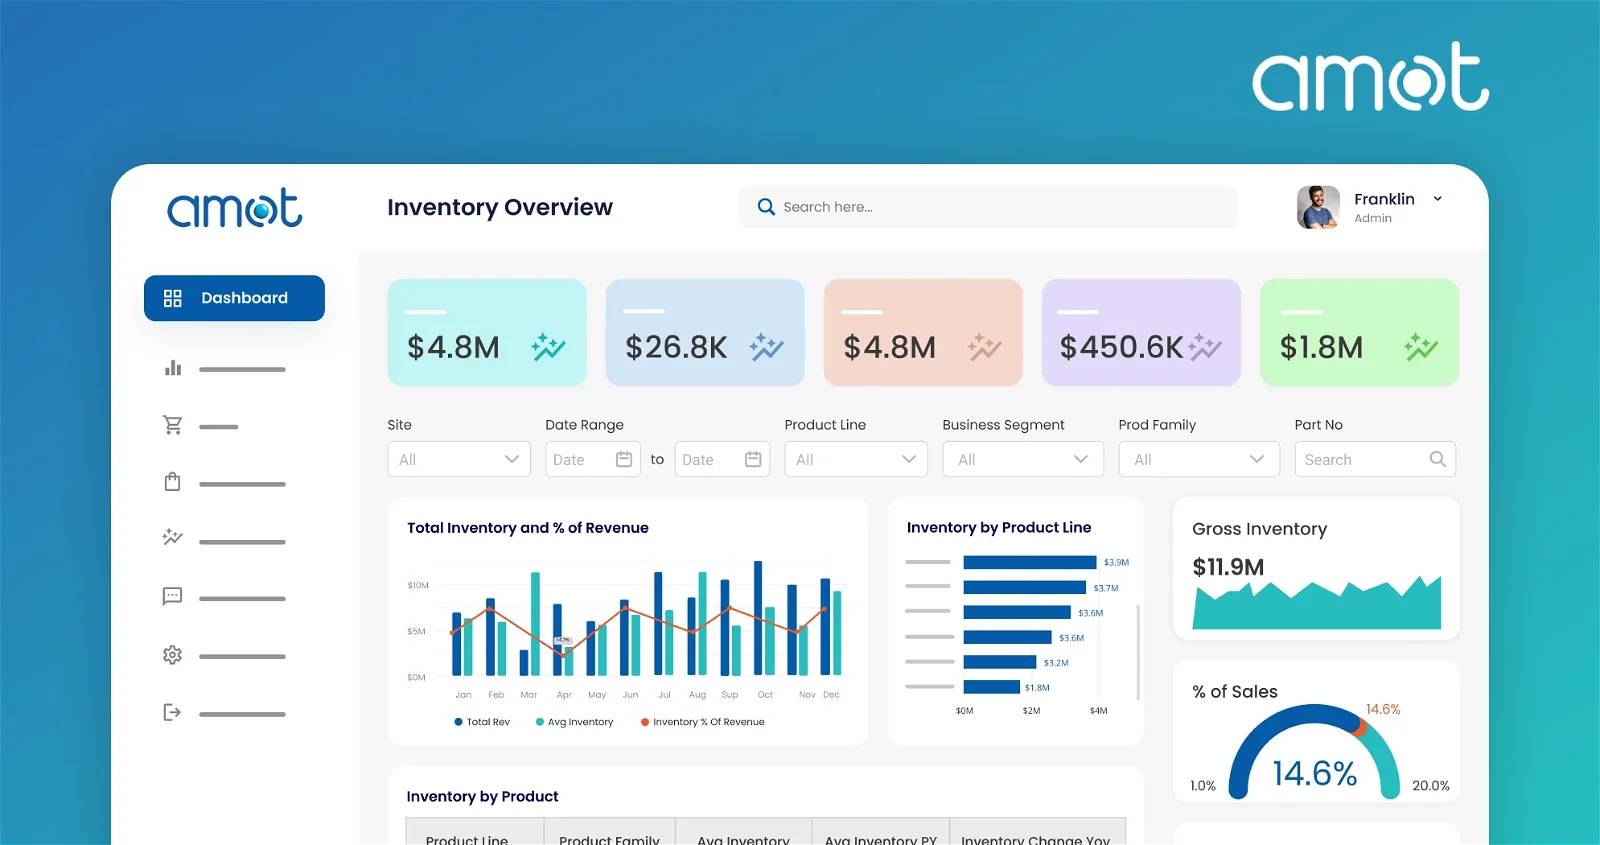
Dashboard Visualization to Assess Sales and Finance Teams’ Goals
Pacific Corrugated Pipe Company is based out of California and specializes in making pipes both readymade and custom based on market demand. With development centers in a range of locations, they had a system where they had updates of departments viz. Sales and Finance to name a few. However, tracking this process was completely manual and consumed a huge amount of time and effort, still not convincing about the accuracy. The Sales and Finance teams of PCP largely had an impact on its revenue, so they adopted a Power BI reporting system where they had a centralized view of the sales, finance and fully automated system that not only made the report viewing easy, but also positioned them for quick decision making.
Services
– Data Extraction
– Loading Data in Azure Data Lake
– Quality Check
– Power BI Reporting
Deliveries
– Power BI Reports
Power BI Dashboards for
Quick Reporting
Quick Reporting
01
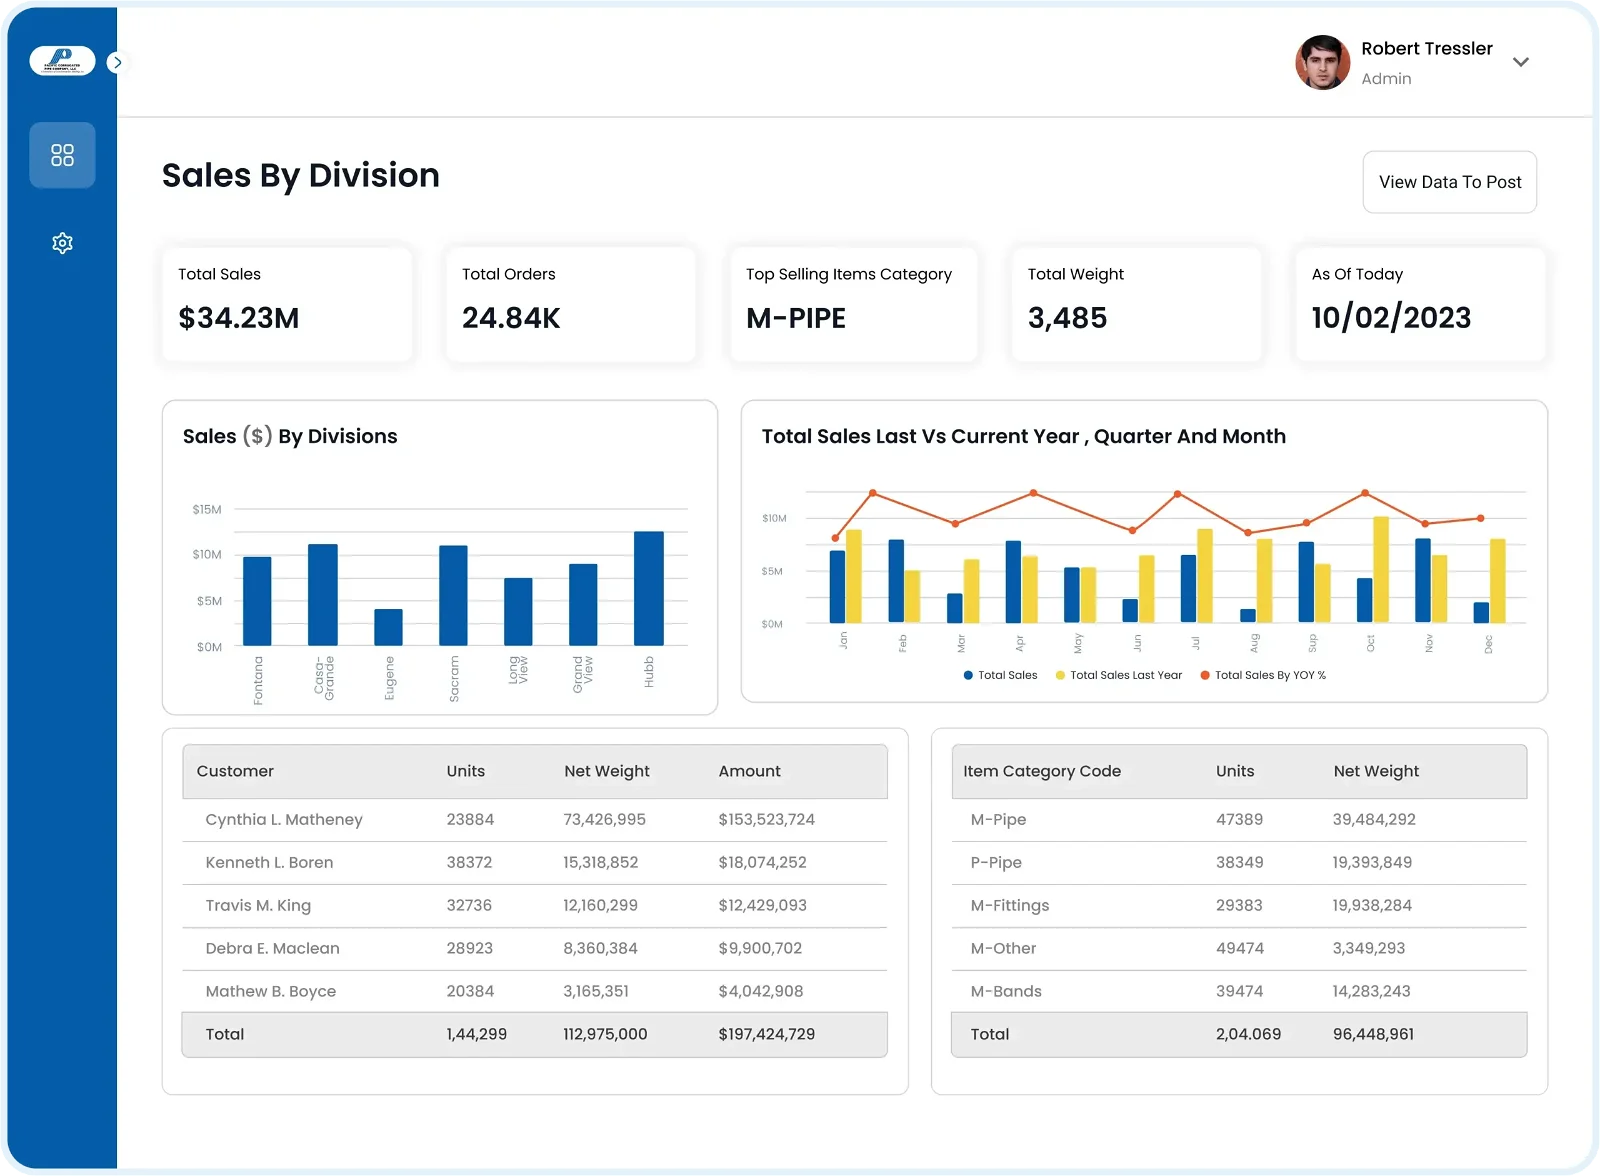
Sales by Division
The sales report of PCP needed to be measured by division or location to figure out how much sales was made in a period of time. A visual insight into this data analysis was required to strategize accordingly and improve the process involved. Few arenas that needed to be classified were total sales, total orders, top selling item category and total weight to gauge the overall performance of the division.
02
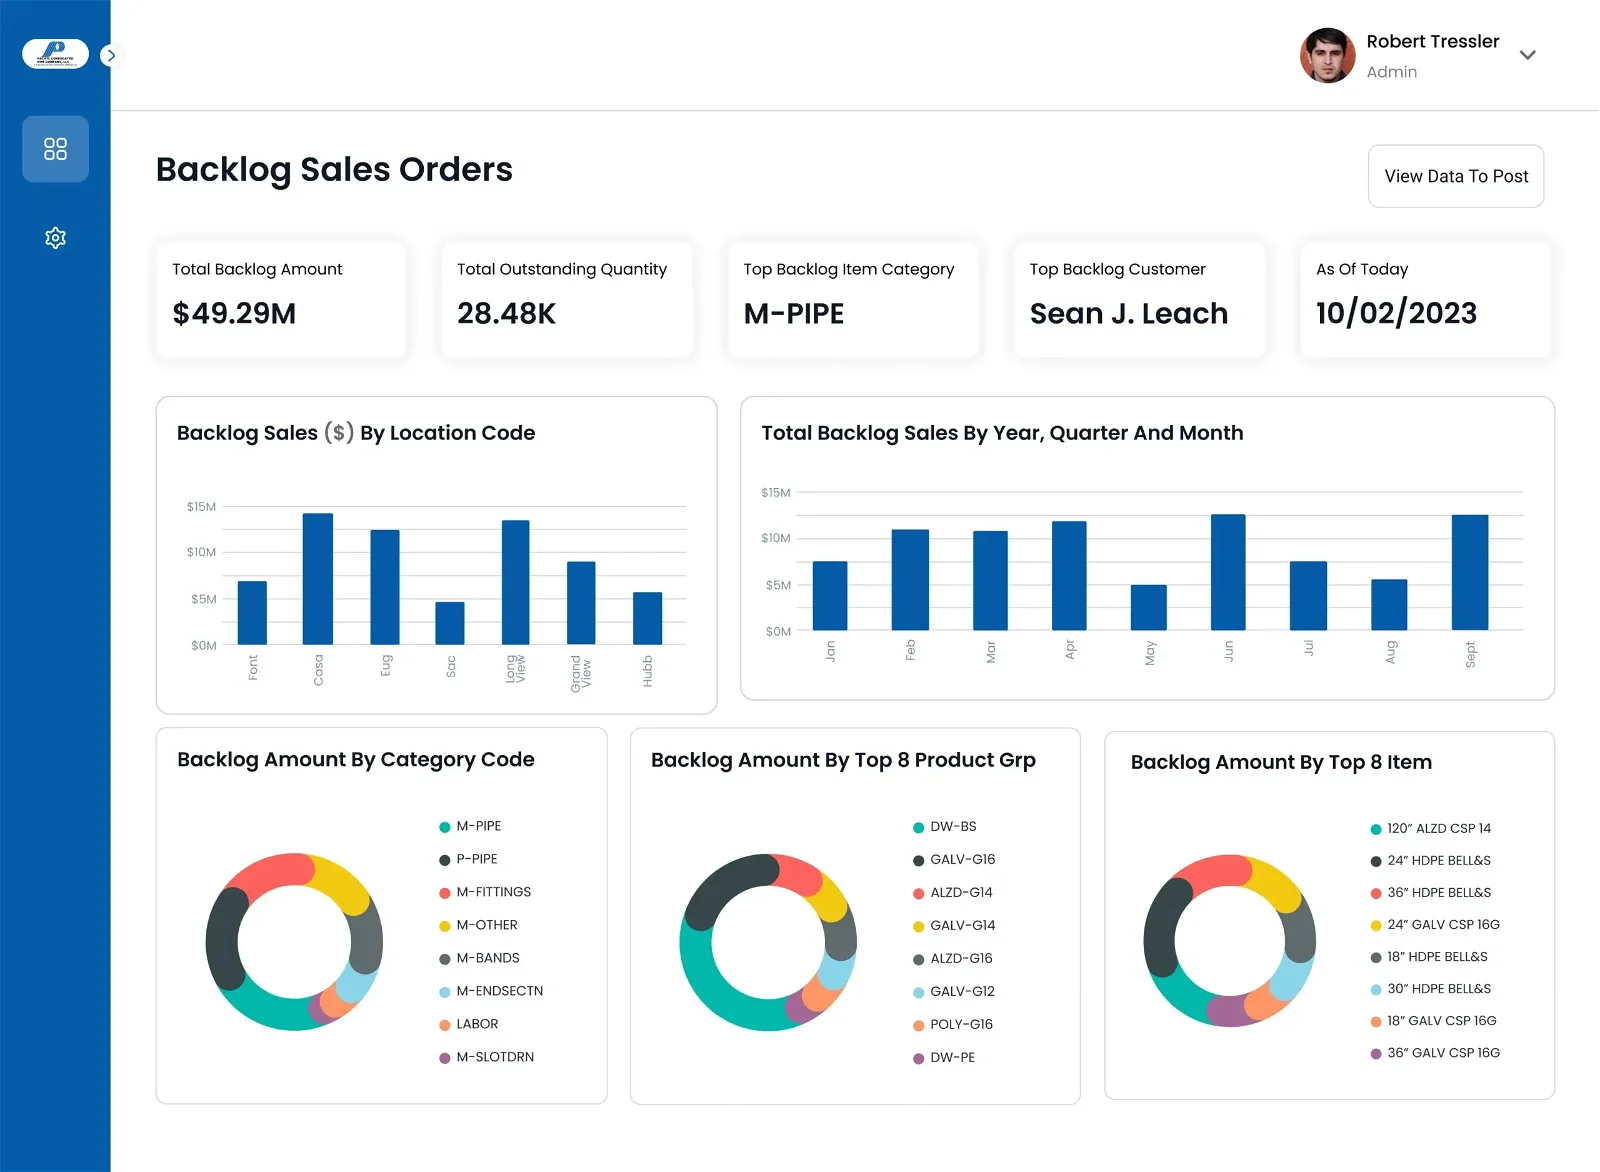
Backlog Sales Order
Numbers alone could not help PCP visualize how much sales order was pending and how to meet this requirement. This was a huge gap since it restricted PCP from quickly analyzing their supply shortage and making amends to increase the supply. There was a dire need for a system that gave a quick data-driven picture of how the demand-supply chain was handled and adopt a process to accelerate the pace of making pipes that were in shortage.
03
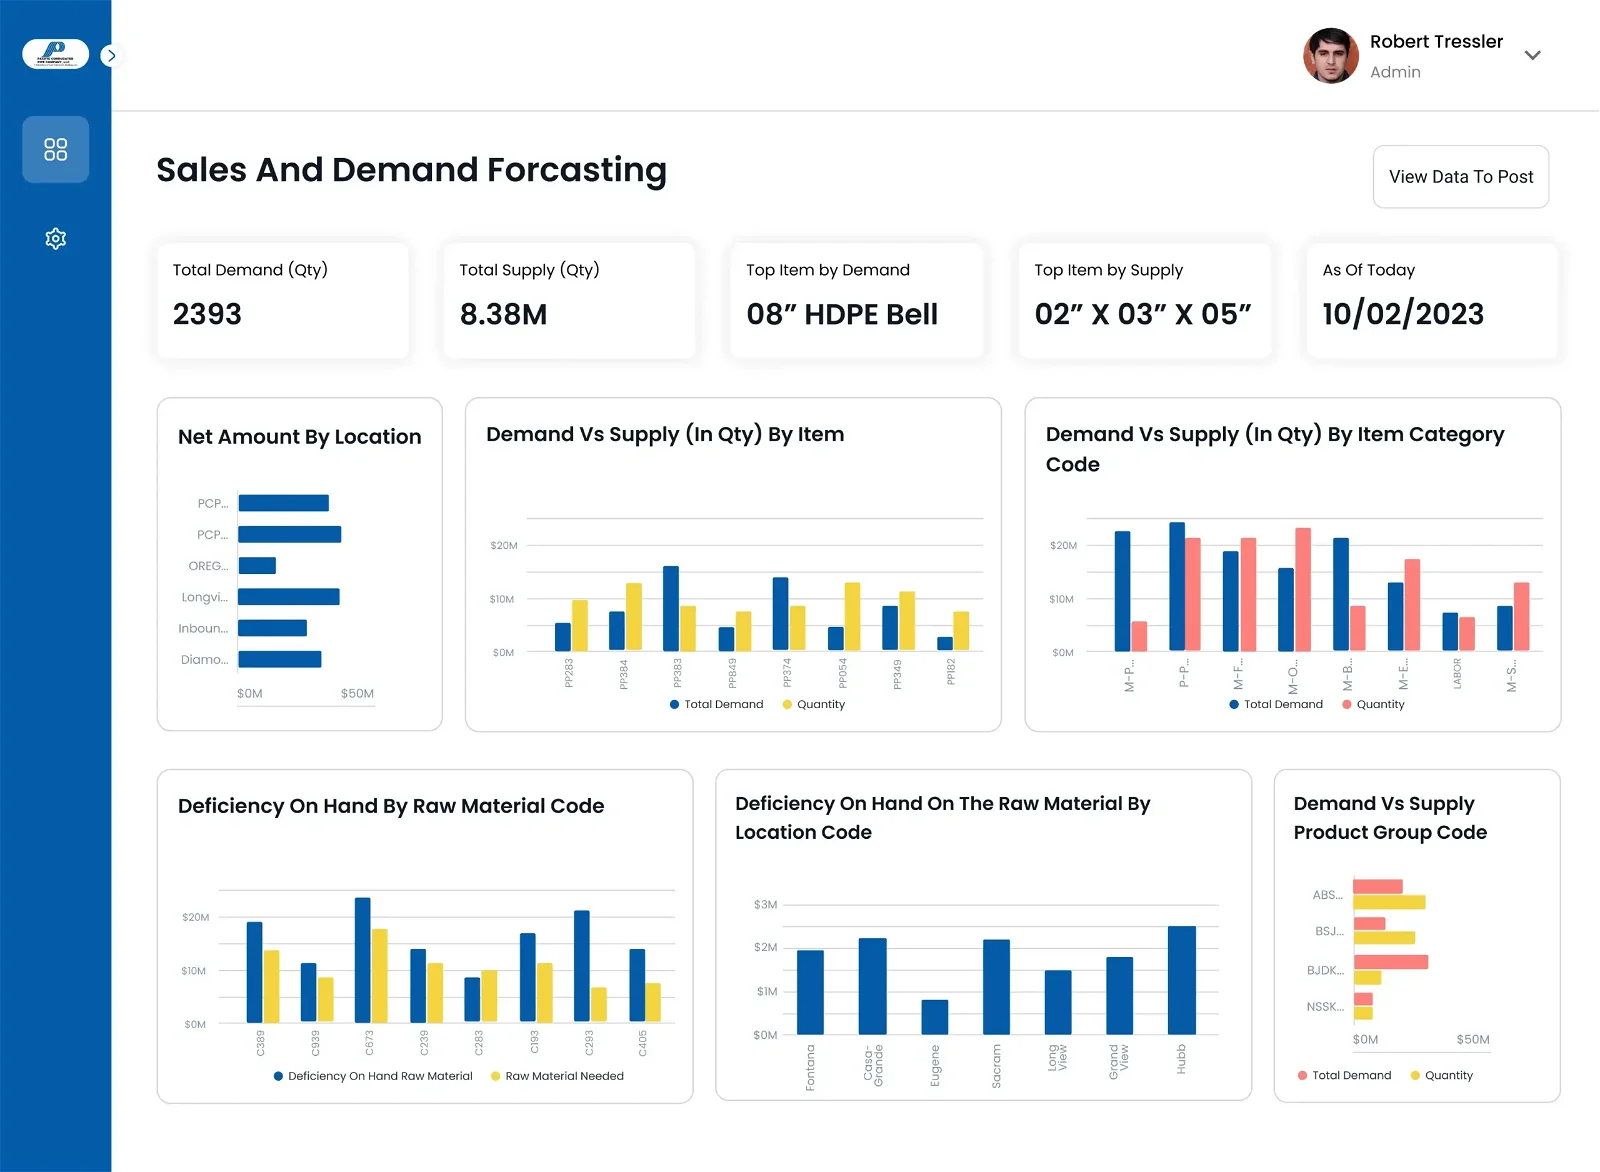
Sales and Demand forecasting
A peek was vital to figure out the supply chain process and be in alignment with the growing demand. There was a necessity for reports to view if the demand met the manufacturing stocks and if not, then how to enable it. Based on looking at the sales and demand in pipeline it could be made easy to predict the future trends, however, for this an automated system was necessary that could easily analyze the trends and make predictions.
04
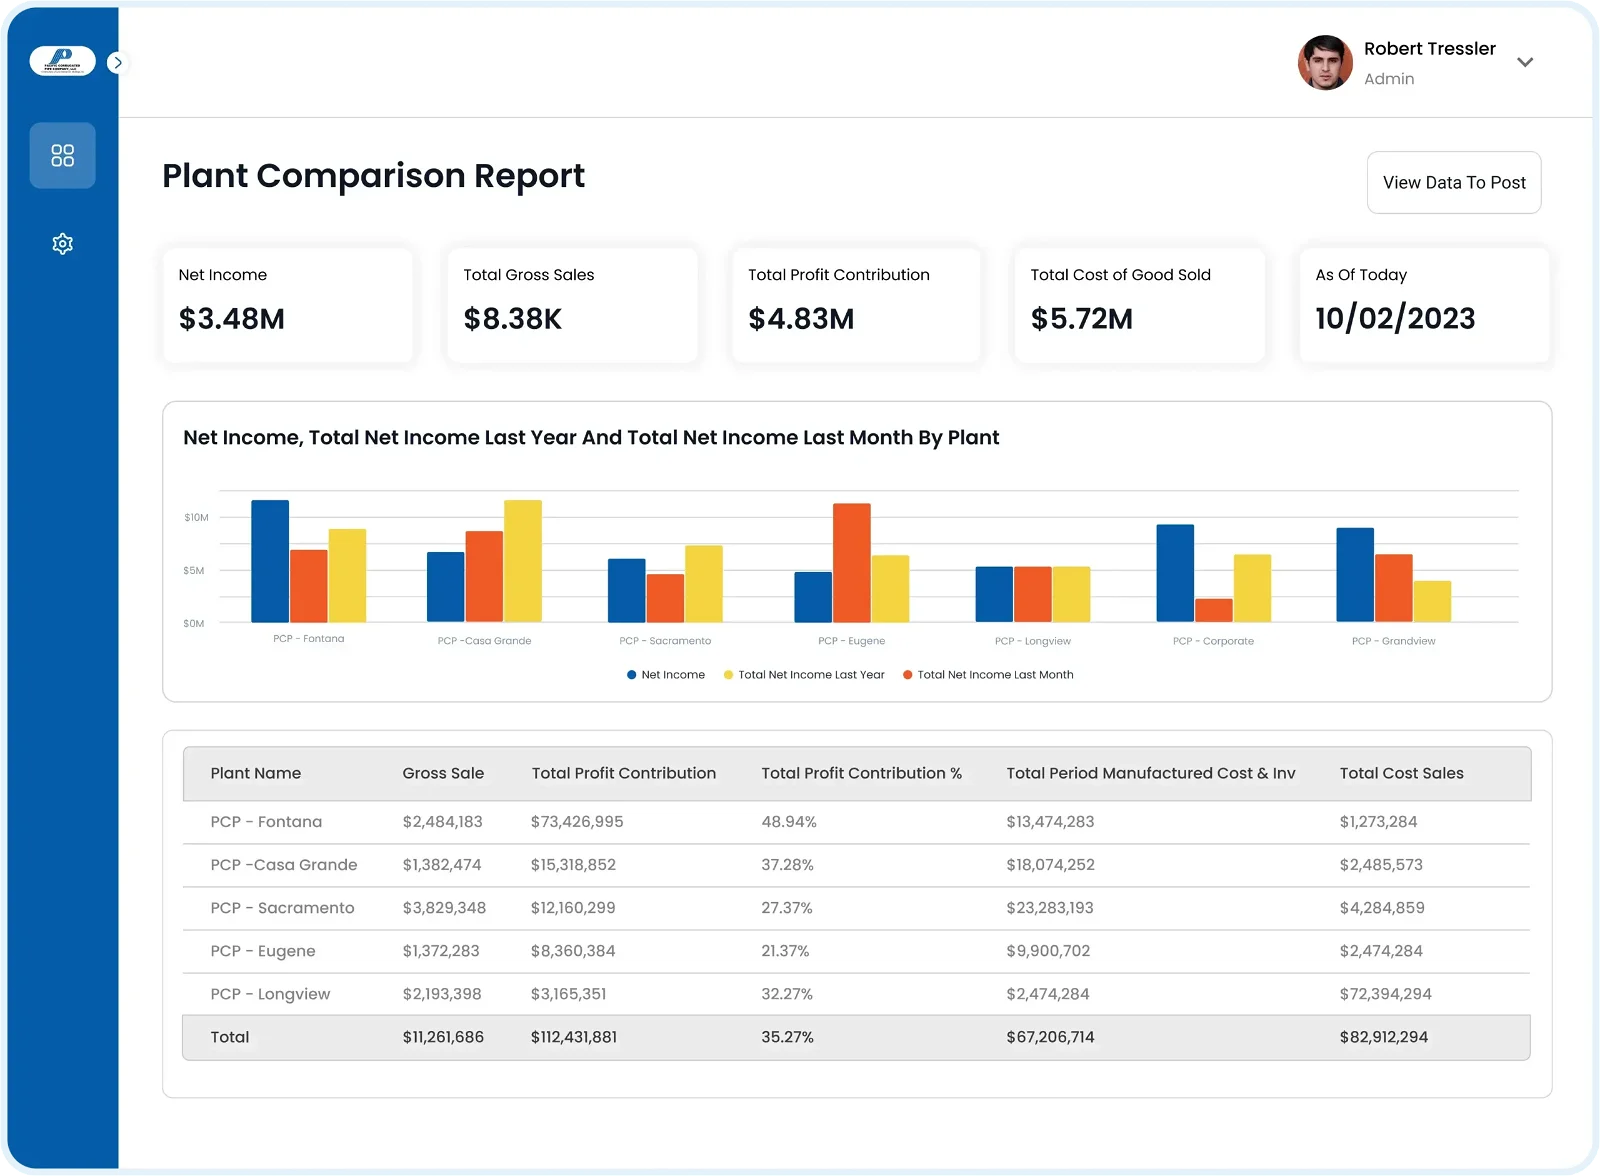
Plant Comparison Report
A continuous process was pivotal to determining how different locations of the plant were performing in terms of sales and finance. Since each plant had its share of complications a numbered statistics without visual insights prevented or slowed down the analytical process and made it cumbersome to visualize how each plant was performing.
05
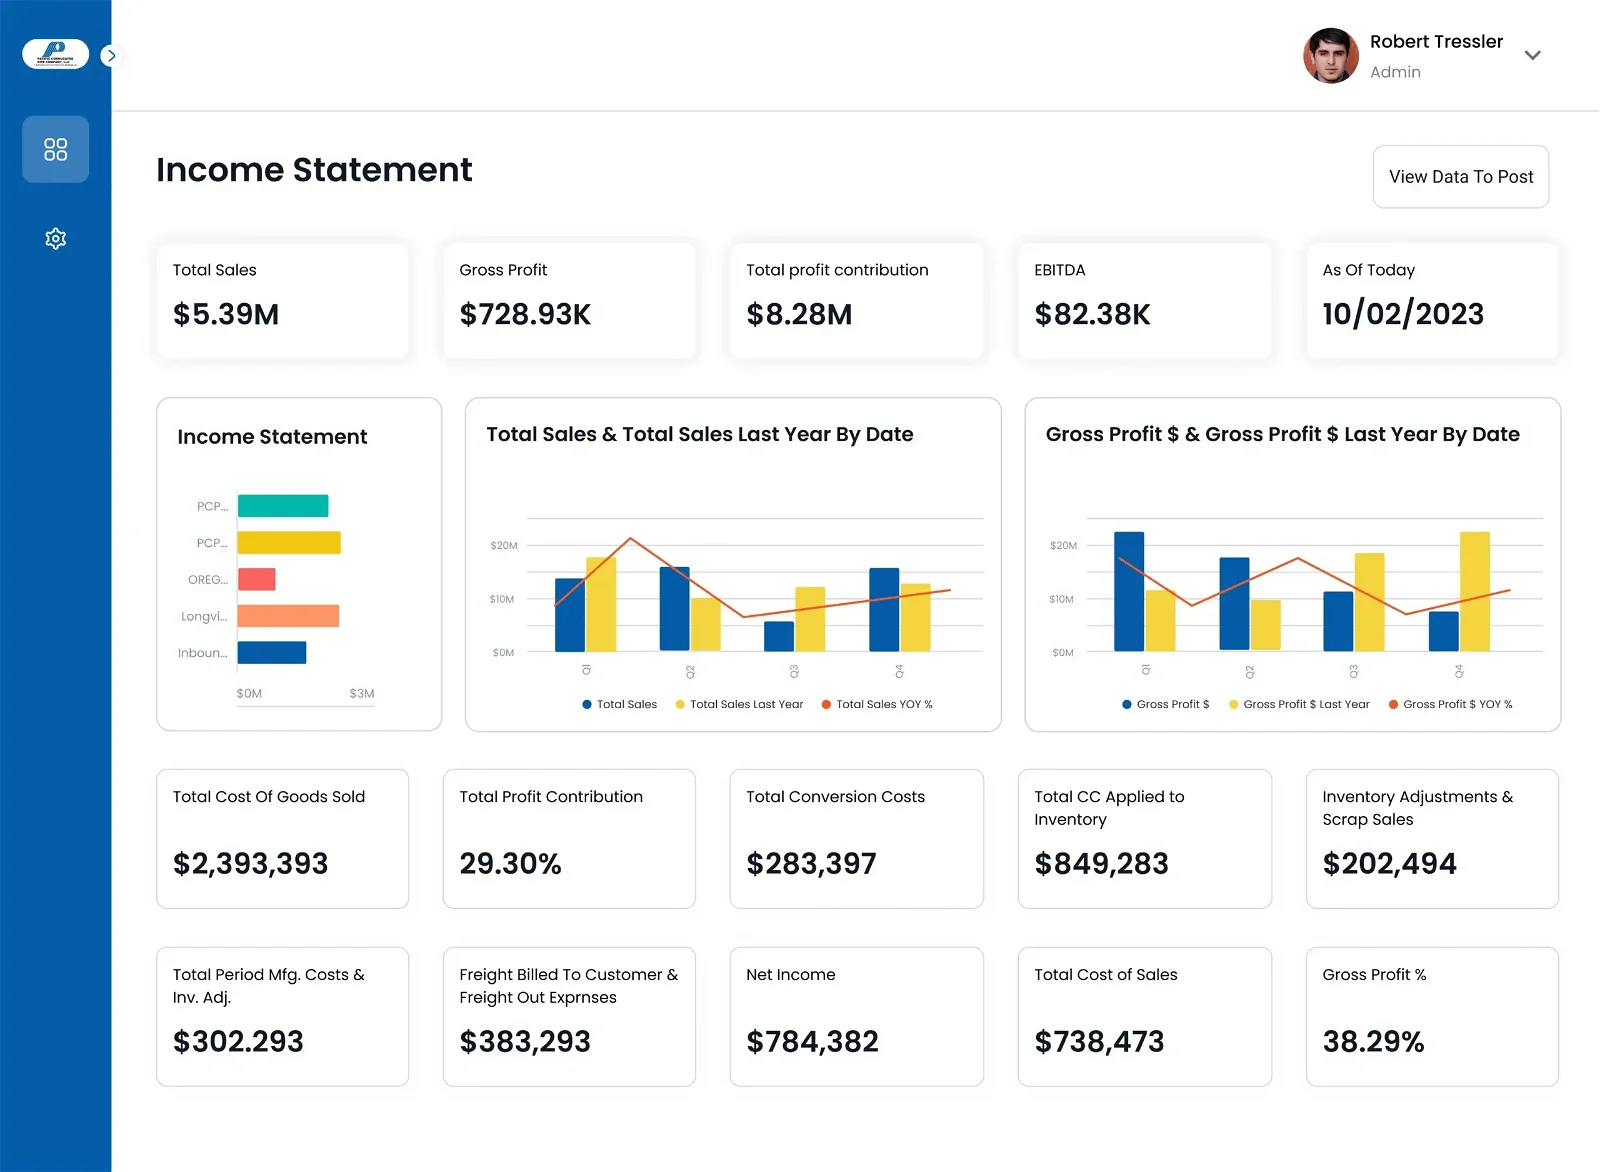
Income Statement
The manual reports lacked a holistic view of whether PCP was meeting its KPIs and what was the statistics of sales and revenue generated by the organization as a whole. The data ingested into the ERP system was manual making viewing the overall performance of the firm tedious and still not providing clear insights. This required a visual reporting system for a comprehensive insight into PCP’s performance and total profit/loss assessment.
Adopting process to align Sales and
Finance departments
Finance departments
PCP wanted to segregate sales by multiple locations that needed to be measured as in how many products were sold in a product group in a given time slot. Also, it was instrumental to gauge the stock needed to be manufactured in order to meet the growing demand in market to prevent demand from falling short.
A visual representation was significant for a quick analysis of the organization level analysis and evaluation of how to strategize and meet demands. As there were multiple plants in the organization streamlining their sales and finance departments in an overview was crucial to make strategic decisions. At the same time, they were existing on an on-premises database server and planned to migrate to a data lake to free the dependency on hardware.
The organization crucially required overviewing if its KPIs were met since these processes were carried out manually it was essential to adopt a process that could enable automation and provide a bird-eye view of the organization’s functioning in a visual format.
Embracing Power BI for Reporting
Pacific Corrugated Pipe reached out to Sunflower Lab for an integrated solution to their pain point and how they could automate the process of visualization of their reports. We came up with Power BI reporting that sourced data from their database server and created visual dashboards enabling them to make data-driven decisions easily. A comprehensive and location-based insight was available to them that positioned them to strategize accordingly. We used Synapse Analytics using which we extracted data from their on-premises MS SQL database server and moved it to Azure Data Lake. After the data was moved to Azure Data Lake a quality check was carried out to check the integrity of data.
This whole process allowed PCP to streamline its decision-making process and a cumulative value of profit or loss was tracked with the key performers in analysis. Plant-based and organizational performance was evaluated and in case the demand was short it could be analyzed easily and met with product development in pipeline.
Reaching miles ahead from legacy system with Power BI reporting
The business ultimately gained immensely from this reporting system. With the Power BI dashboards quick decision-making was possible and moving on the data lake further reinforced the overall velocity of operations. The sales classified by product group, item category, sales order, gross sales, total cost of goods sold, plant performance, profit/loss, and other KPIs could be gauged easily. This made it possible for the stakeholders to analyze the performance of plants and the organization as a whole and make decisions that could contribute to the overall growth of the company.
The solution proved to be a game changer and set them miles ahead of their legacy system.
Do you have a huge volume of raw data
you want actionable insights from?
you want actionable insights from?