Now that flutter is gaining popularity for its performance and speed exponentially, there are thousands of developers working each day to make an application. You can be just one of them or you can stand out. What can a developer do to make the application that s/he developed standout? Well, here is your answer – “Flutter Dev-tools“.
So now you may ask what exactly is this dev-tools? Dev-tools is set or collection of different features that will help us check how our app is working for different criteria. Right now, it is in beta state but the good thing is it’s in very good active state. So hopefully we can have a stable version soon enough. As I mentioned before Flutter Dev Tools is not just a single tool but set of tools which includes:
- Timeline view
- Memory view
- Performance view
- Network view
- Debugger
Each of these tools has its own purpose and behaves in a very different way. If used correctly each tool will show us how our app is performing in each criterion. For example, if our app is using too much memory, memory-view will warn us about it so that we can improve that and manage our application footprints properly.
At the end what all tools will do is make our application somewhat better in their own way. So, at the end of the day the app we have will be much better than we had before using dev-tools.
Enough with the explanation let take a deeper look at some of the tools so that it will make it easier to understand. But to use them in our application, we first must know how to install them right?
Well, the process is different in all IDEs. We will see two of the widely used IDEs that is Visual Studio code and Android studio.
ANDROID STUDIO
Go to android studio, open marketplace. Search marketplace for Flutter plugin. Once we find it just download and install. But to use the flutter dev-tools we need an app in running state in a connected device. Because it is on beta state right now, we cannot use it on an emulator right now. We can hope that it will be available soon.
So, make sure we have a device connected and app in running or debug state to use different tools. Once application is in one of those state go to Run -> Open DevTools or for android studio only there is a shortcut available on Flutter inspector-view. Just click on more Actions and we will find Dev–Tools over there.
VISUAL STUDIO CODE
It is easier to use Dev–Tools in visual studio code all we need to do is install dart plugin. But I hope it is already covered as we are about to test the application. We should have already installed flutter extension as well but if not, let’s see how to install it.
Well hard part is done now all we have to do is run the application. Now open visual studio command palette (Ctrl + Shift + P). Type “Dart: Open DevTools”. This will show Dart DevTools in your status bar. Now we are good to go.
COMMAND PROMPT
If none of them is working for us, what we can do is install it with help of your command prompt. The procedure is quite lengthy and may be little bit confusing as well. Flutter docs had this procedure covered in details which can be found over here:
https://flutter.dev/docs/development/tools/devtools/cli
Now that installation part is covered and we are ready to use the tolls. Let’s take a deep dive in some of the tools available right now. First tool we are going to cover is one of the most commonly used tools that is Performance view.
PERFORMANCE VIEW
Do you want to record how well your application is performing on CPU? Do you want to record a session of your application in a particular time and then profile it? Well, here is the tool we all need.
The tool we are going to use is called CPU profiler. What CPU profiler does is once you press start recording button it will start recording different data and store them in Virtual Memory once you press the stop button it will grab all the data and it will display it in different forms and you can see it in profiler views. There are three different type of chart available which displays different data.
1. FLAME CHART
The flame chart is considered as top to bottom chart. Where each entry is called a stack. The meaning of this is top most stack is parent for all the stack below them. In other words, top stack calls the stack below it. Now that covers the vertical part of the chart. What is the meaning of it horizontally? So, width of each stack is the time it spent on CPU. The higher the width, higher the time it spends on CPU.
Now once we have recorded for some time what we can do is find out which stack is taking more time than it should and try to modify it somehow and cut the time it spends on CPU. This will improve your performance quite drastically.
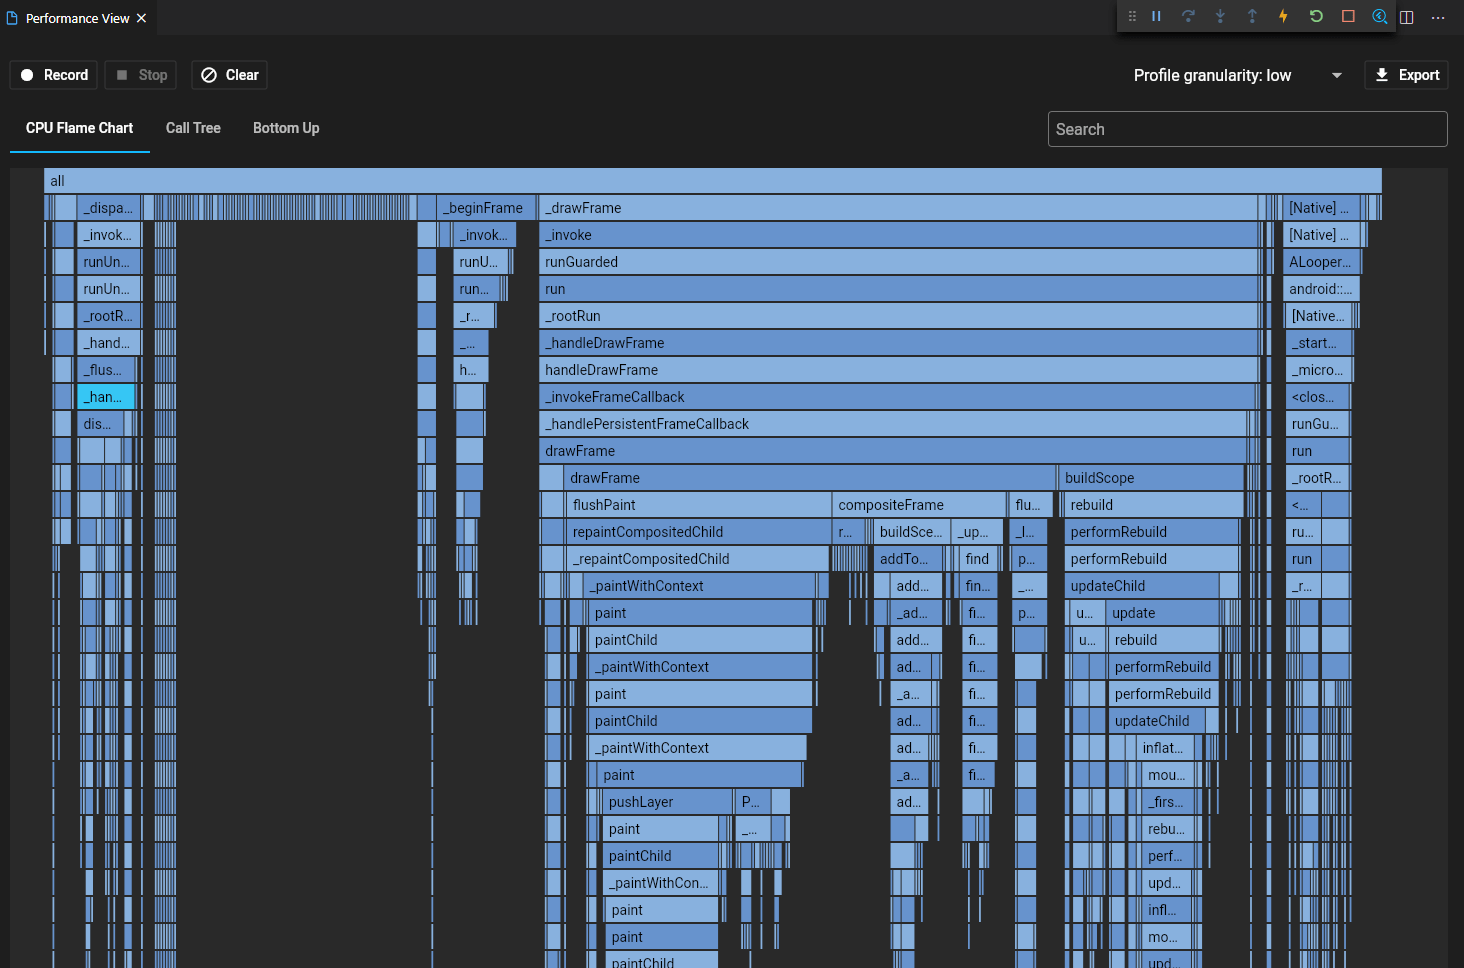
Here is the screen shot for the small app running in the device. We can also download a JSON file for this chart by pressing the Export button on the top right corner. This will download a JSON file which you can share with your colleagues. This is just an overview you can zoom-in on any part in your chart to see them more clearly.
2. CALL TREE
For this one the name is self-explanatory. What this does is it shows you the hierarchy of method calls. We can expand any of the method to see the call made by it or in data structure language its child. In short, it’s a top-bottom profiling same as flame chart but in text representation.
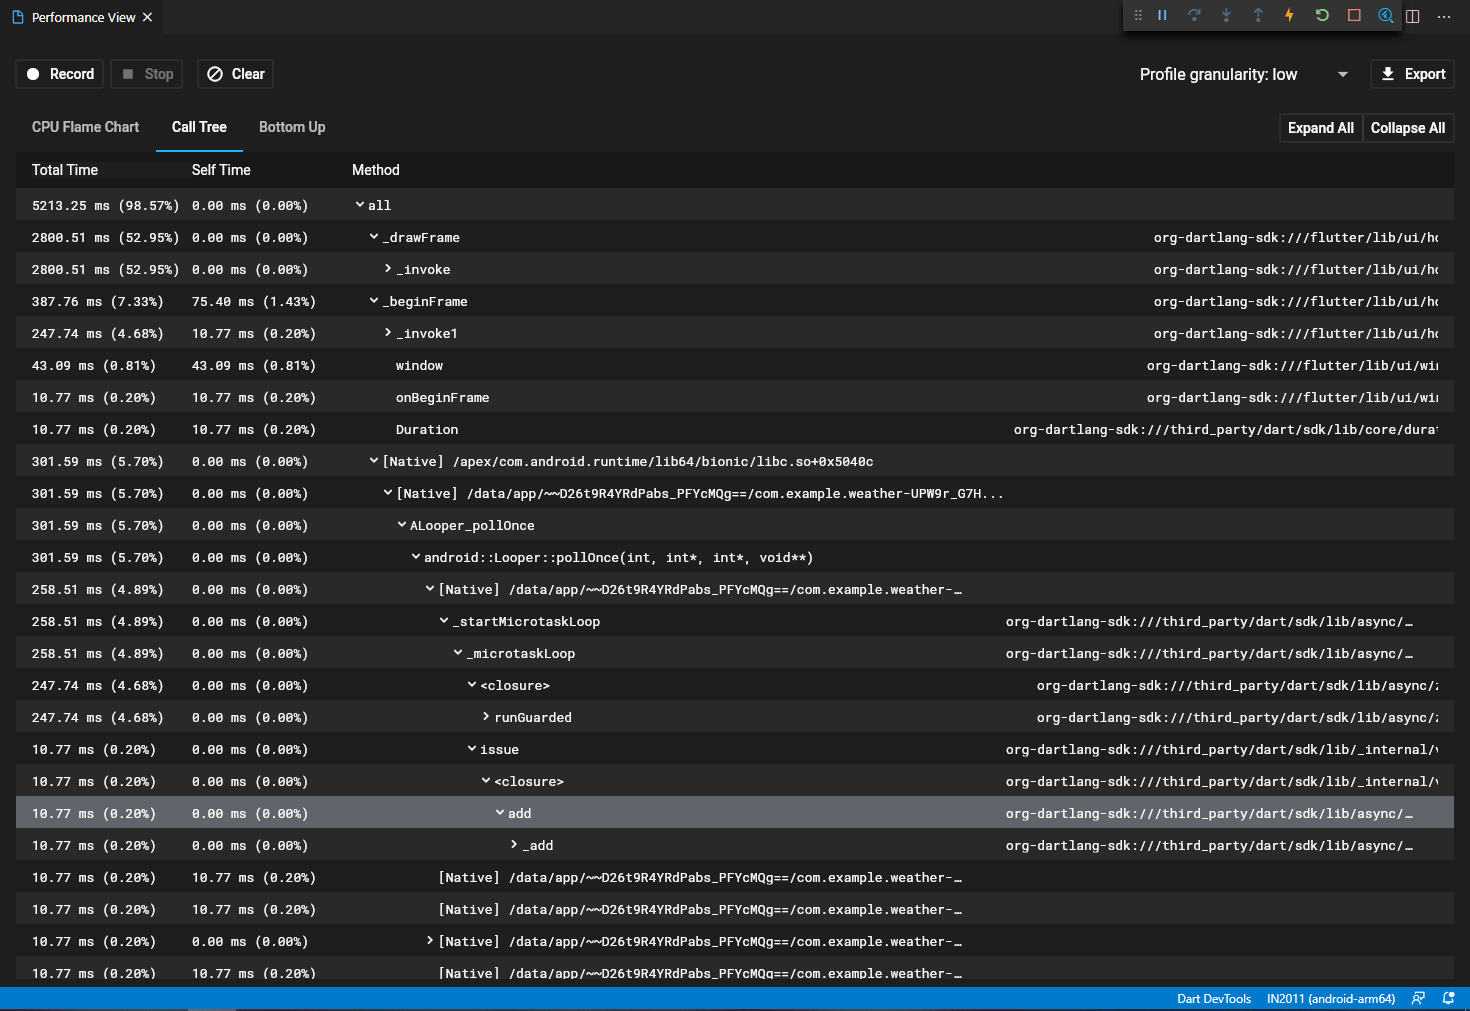
As you can see in example There are three categories for each method.
- Total Time shows total time spent by this method and its children.
- Self-Time shows time spent on CPU by only that method. This doesn’t include time spent by children
- Method shoes name of the method. We can click little expand icon beside the name of the method to see its child.
3. BOTTOM UP
In some way bottom Up is same as call tree but only in reverse way. What this means is method on the top was the last method in CPU. Again, in data structure language method on top is leaf node and the method below it is its patent. Otherwise categories displayed are same as call-tree. Here is a screen shot of the same application.
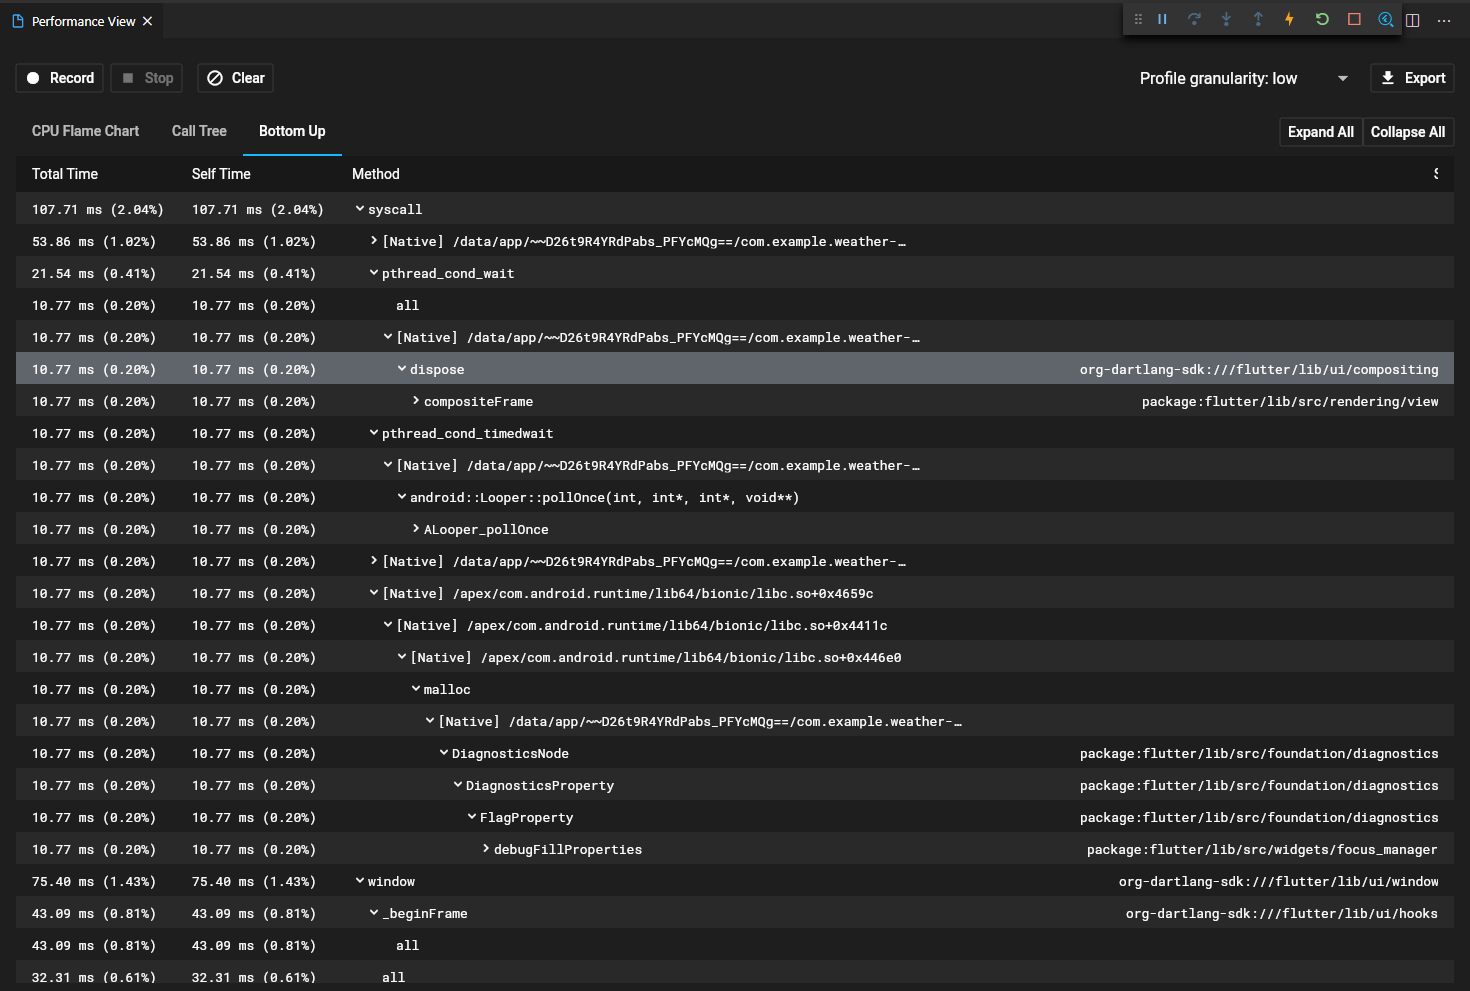
So, this pretty much concludes everything in Performance view. But one part left in this screen is granularity. There is one option to select granularity. What granularity means is how quickly samples are recorded. If the granularity is set to high performance view will take samples in quick succession and if it is set to low it will wait for some time before taking next sample.
That’s how you measure CPU performance and after reading it we can do some quick changes. Let’s jump to the next tool which is Network view.
NETWORK VIEW
In the era of IoT most of the applications are using internet. So, there is very high percentage of chance that application that we are going developed will use internet as well.
Now we don’t want our application to make too many requests or download large amount of data every time page is changed. This will make our app feel less responsive and there will be some latency between app and our user.
So, we should keep usage of network request in limit and keep a good track of them. For all these need dev-tools provide a tool and that is network tool.
Network tool allows you to monitor all the HTTP and HTTPs request the application is making. Not just request but if you want to check the information about socket usage network tool is your go-to guy.
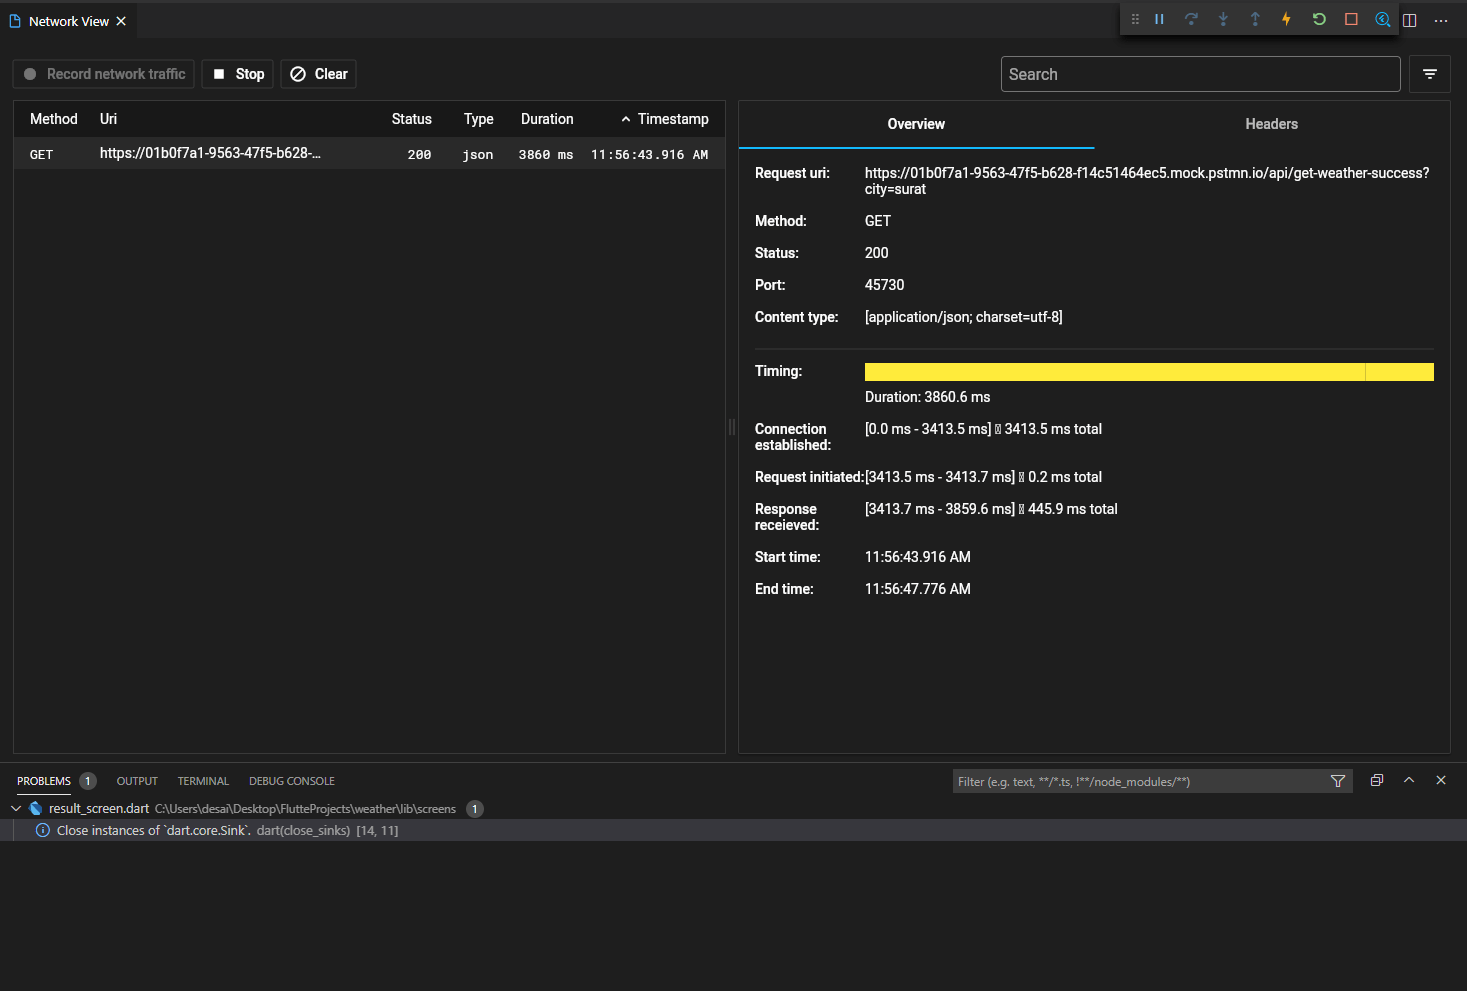
This screen shot shows a simple GET request. In details you can find time took to get response, type of request, status, port number, connection type and many more useful details.
MEMORY VIEW
The main purpose of the memory view is to check how memory allocation is going on inside the heap. One of the most common problems is memory leak. If we want to find out memory leak in our application this is the best tool for it.
Memory tools have so many options available to explore that it is out of the scope of this article. Unlike other tools we have seen before we don’t have to start recording of the memory. It will automatically starts recording once we go to memory view page. It is possible to pause it from control panel.
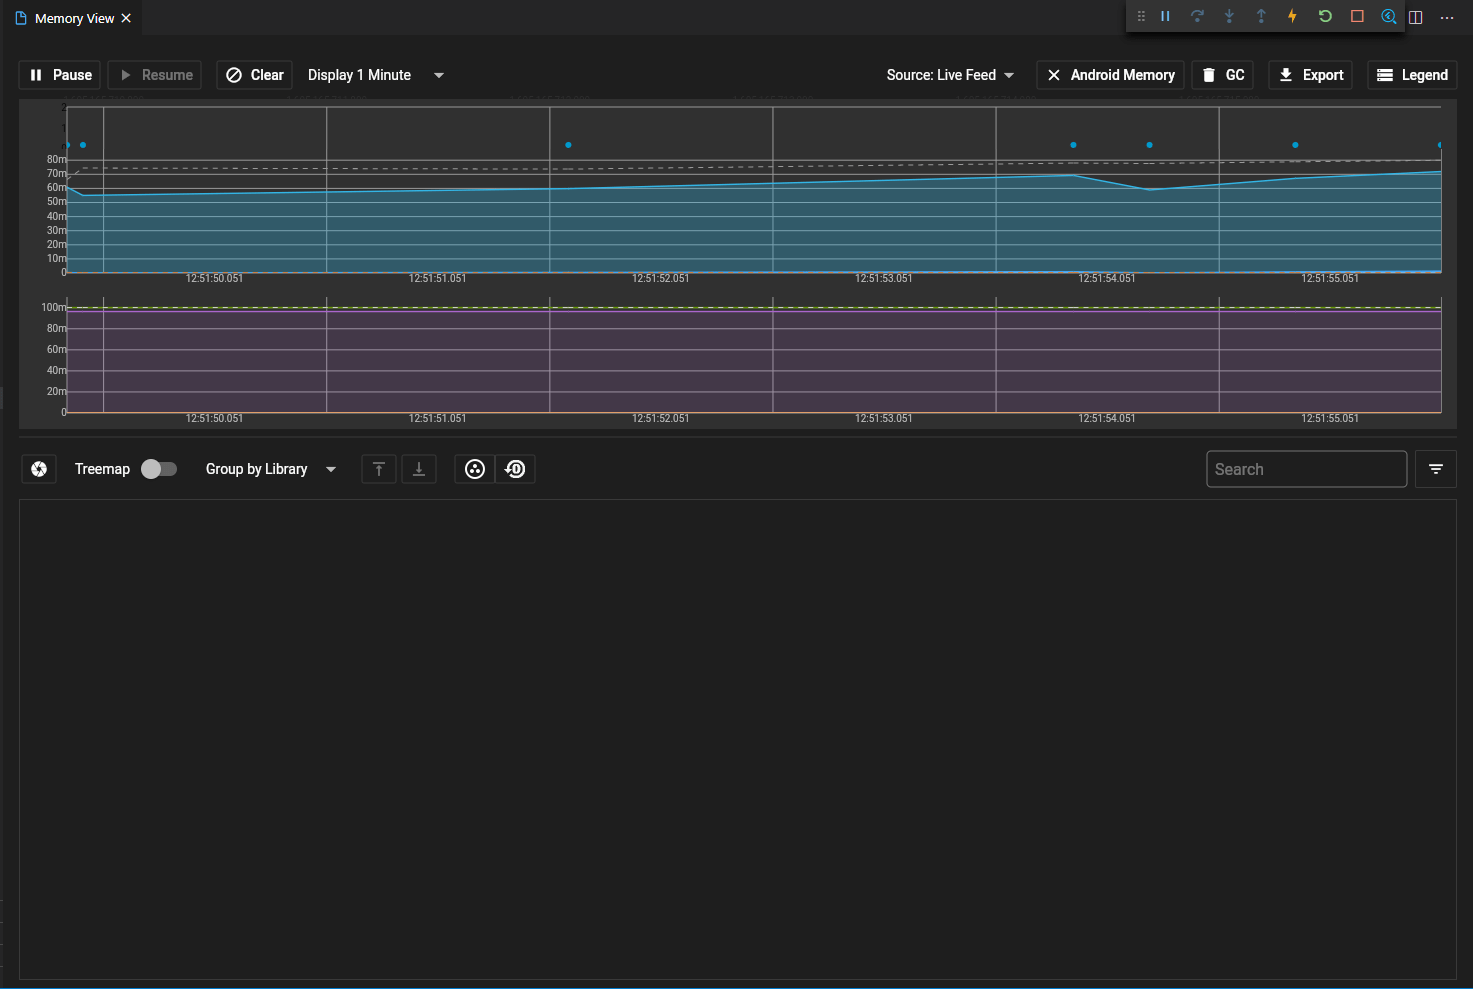
The blue graph on the top shows the memory used by your app over selected period of time. This time can be 1 minute, 5 minute or 10 minutes, which can be selected from the top. We can click on legend to see more information about memory at that particular point.
Data on X-axis shows the time at which record of the heap was taken. While Y-axis represents the size of the heap or memory that application was using on that particular time period.
If you are running on the android device memory view will collect data from Android Debug bridge which is displayed in purple graph in the screen shot.
FLUTTER INSPECTOR
Getting confused between how you expect your widget tree vs one you are seeing on screen? Well, your savior is here. Flutter Inspector is a helping tool rather than performance measurement tool like all those we have seen before this.
Flutter inspector will show us our exact widget tree. This will help us understand our current tree and find out the issues that may cause your UI to looks different or not same as your expectation.
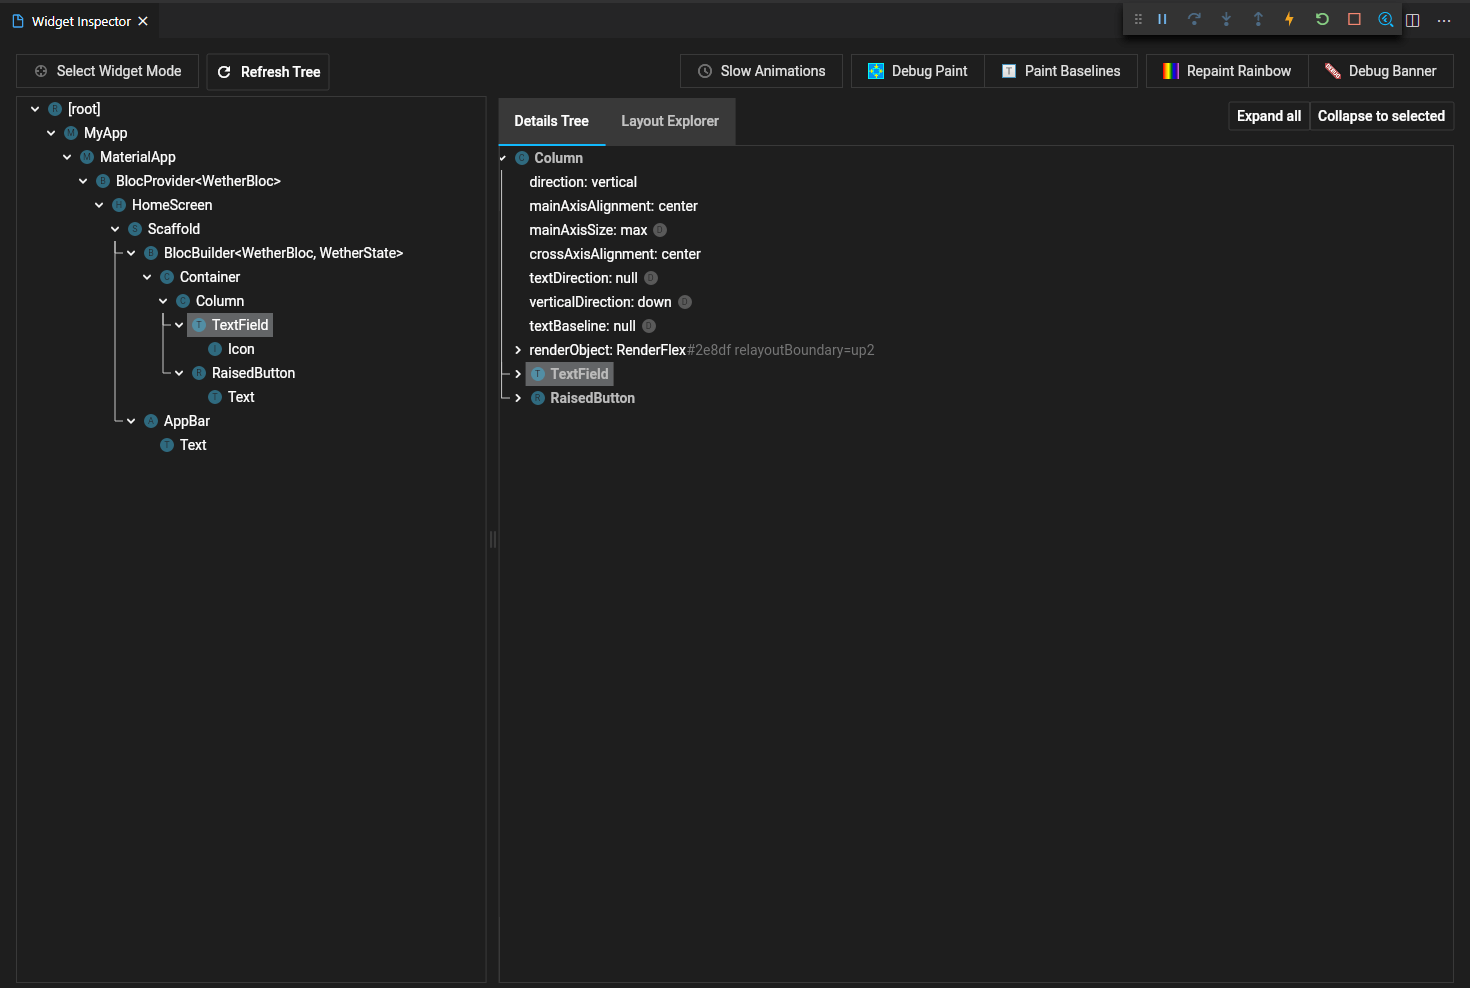
Here we can see perfect hierarchy of our widget tree. It is easier to find out which widget is out of position or causing some problems. Once we determine which widget is part of the problem, we can just click the name of the widget on right hand side and tool will automatically take you to definition.
FLUTTER LAYOUT EXPLORER
Impressed by all the tools you have seen till now? Well, I’ve been keeping the best one for the last and that is Flutter layout explorer. It is currently under development and because of that it only supports Row, Column and Flex widget but still very powerful and useful tool.
I am sure as flutter developer you have faced the issue of pixel overflow error. It simple most of the time but sometimes it can be a head scratcher. Well flutter explorer lets you see how your widget will be rendered in real time. We can adjust size of widget, position, alignment, flex etc. so that you can fit your widgets according to your needs and all that with all functionality we saw with flutter inspector.
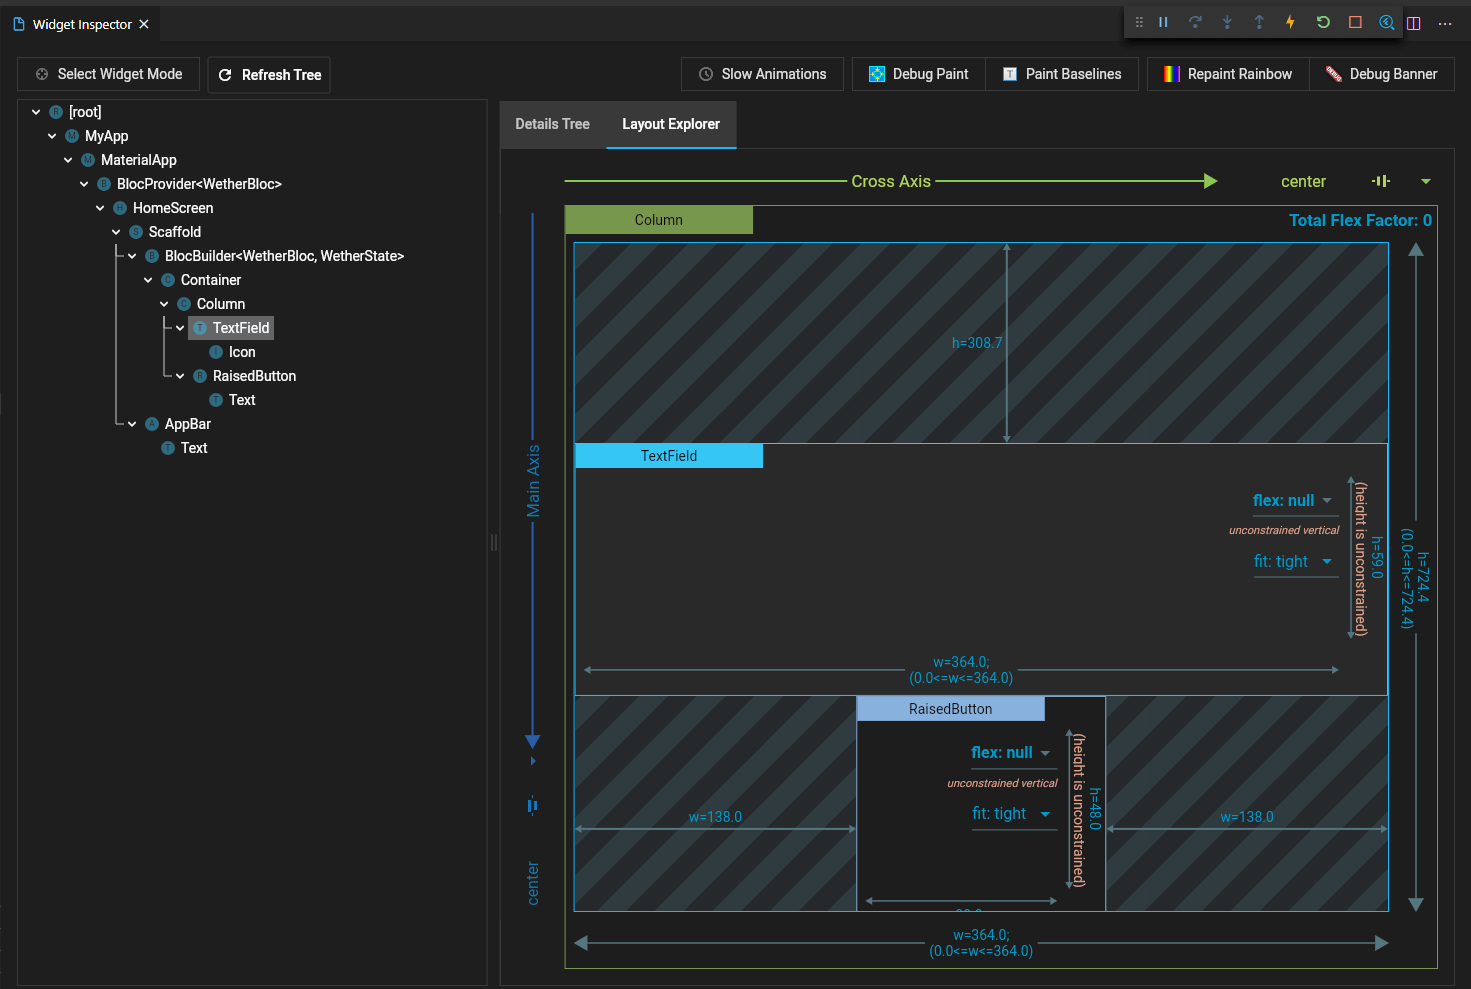
It is kind of difficult to explain this tool with just help of static image. Just give it a go, it’s very easy to understand and very powerful tool.
In the world of thousands of flutter developer, give yourself an edge. Use all these powerful tools to standout and improve quality of your application drastically.
REFERENCES:
- https://flutter.dev/docs/development/tools/devtools/overview
- https://flutter.dev/docs/development/tools/devtools/android-studio
- https://flutter.dev/docs/development/tools/devtools/inspector
- https://flutter.dev/docs/development/tools/devtools/timeline
- https://flutter.dev/docs/development/tools/devtools/memory
- https://flutter.dev/docs/development/tools/devtools/performance
- https://flutter.dev/docs/development/tools/devtools/network
Get a FREE estimate for your project today.
Our team of experts will review your project and give you a quote at no cost.
Related Posts
Top-Down vs Bottom-Up: Which Automation Approach Should You Choose?
With over 78% companies implementing RPA, it’s time you give it a thought too and to guide you through it, we have a rundown of two…
Top 5 Power BI Hiring Mistakes to Avoid
Building a robust analytics team is essential for modern businesses. Power BI, a powerful data visualization and business intelligence…
You might also like
Stay ahead in tech with Sunflower Lab’s curated blogs, sorted by technology type. From AI to Digital Products, explore cutting-edge developments in our insightful, categorized collection. Dive in and stay informed about the ever-evolving digital landscape with Sunflower Lab.