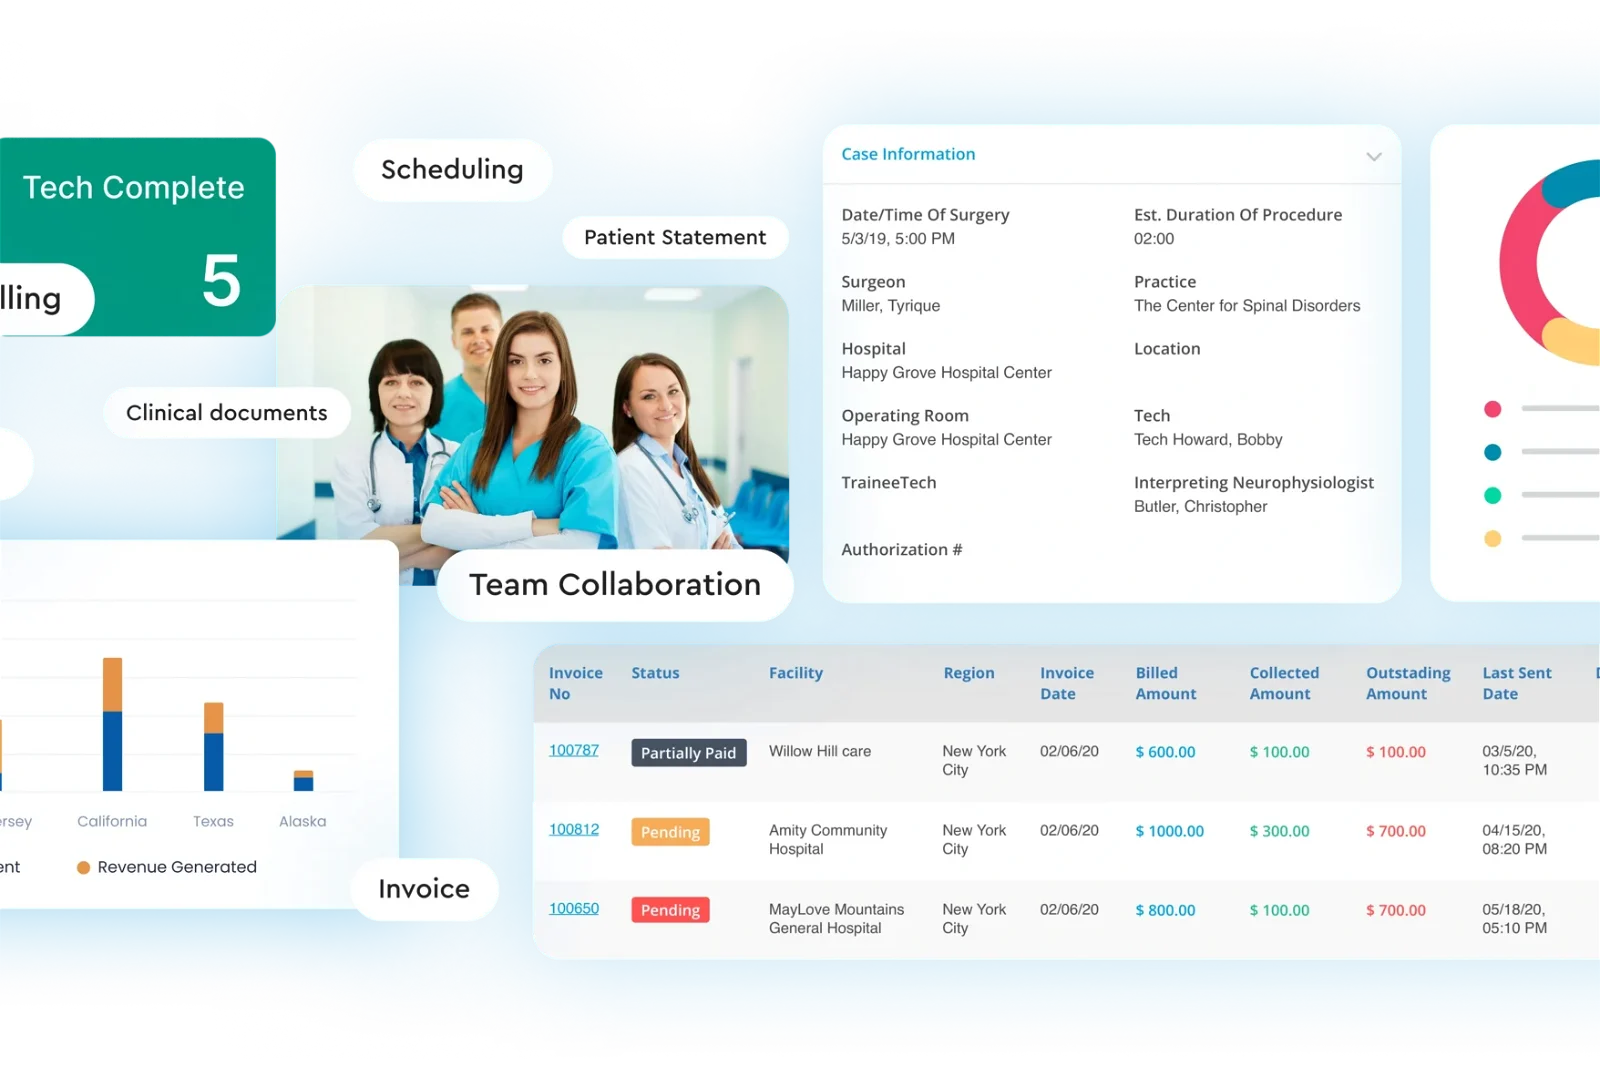
When it comes to effectively managing your business’s service desk, having deep insight is what always comes first. In the constantly developing sector of IT knowledge-based decision-making is actually the distinguishing proof of whether operating business well or at worse minimum existence. We present the Power BI Service Desk Dashboard—an innovative and user-friendly tool that boasts intuitive data collection modules and visual data representation techniques to not only collect but also reveal the way to improvement in terms of operations as well as service delivery.
From tracking ticket trends to analyzing agent performance, the Power BI development services offer a comprehensive view of service desk operations. The flexibility of Power BI allows organizations to customize their dashboards to suit their unique requirements, providing a personalized and intuitive user experience. Additionally, the integration capabilities of Power BI enable seamless data integration from various sources, ensuring that organizations have access to real-time, accurate data.
Key Metrics to Include in Power BI Security Dashboard
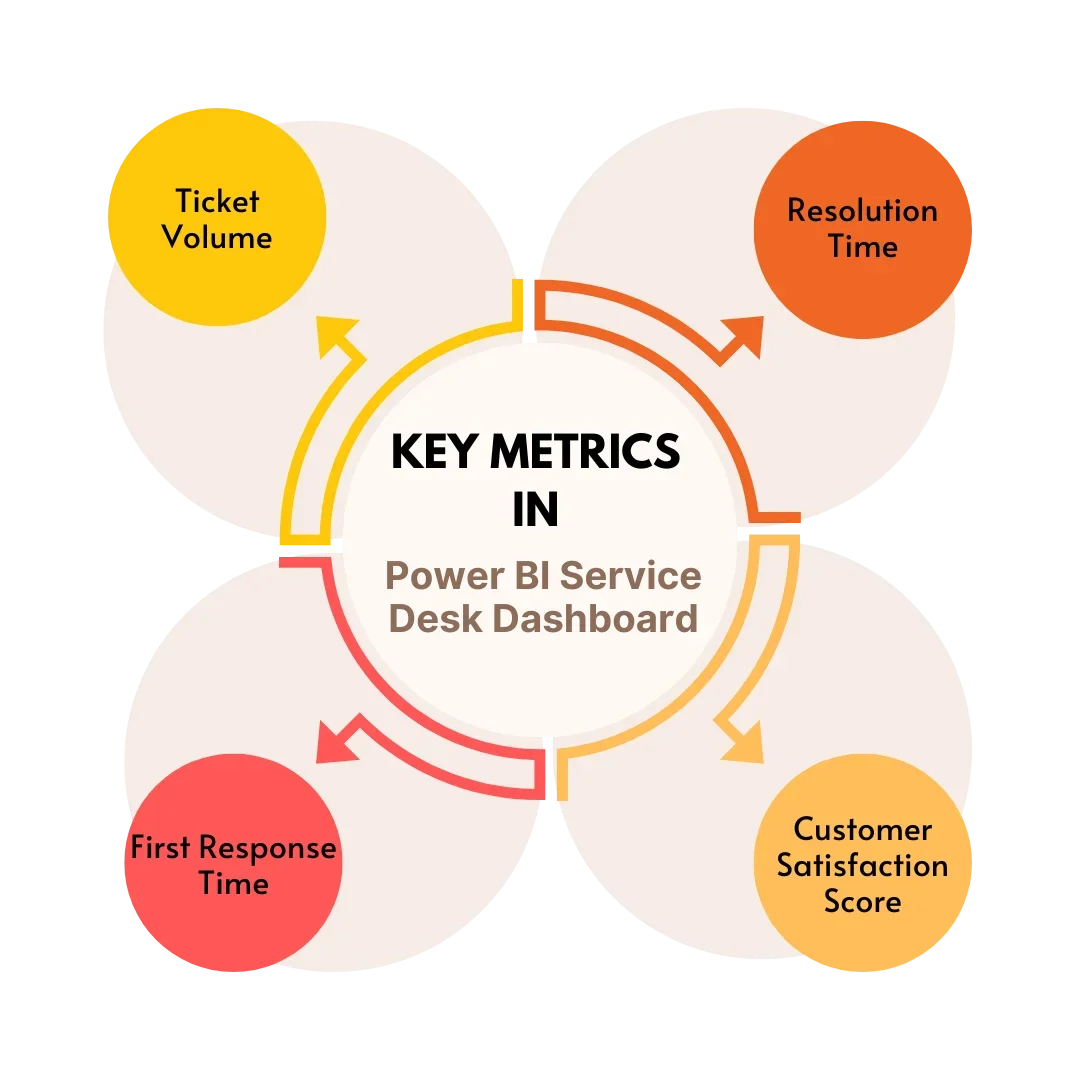
Managing a service desk efficiently requires tracking key metrics that provide insights into your team’s performance and customer satisfaction. Including these metrics in your Power BI service desk dashboard can help you make informed decisions and improve the overall effectiveness of your support operations. Here are four essential metrics to include:
1. Ticket Volume
The ticket volume metrics track the total number of tickets received, resolved, and pending. Understanding ticket volume helps you assess the workload of your team and identify patterns or trends in ticket inflow. The big network of hospitals takes an opportunity to connect IT support assistance with its various departments and medical facilities by implementing a Power BI service desk dashboard. With the help of ticket volume tracking, the IT team can pinpoint departments that are heavily burdened with IT issues being more frequent.
For instance, this can be shown typically in the Radiology group that witnessed a high number of tickets that might indicate a problem in their imagery systems. One of the most effective measures could be to allocate a budget in time for these issues to make sure the healthcare services are not disturbed.
2. Resolution Time
This metric measures the average time taken to resolve a ticket. It is a key indicator of your team’s efficiency in resolving customer issues. A high-resolution time can indicate blockages or inefficiencies in your support process. If certain types of tickets consistently take longer to resolve, it may be worth investigating the root cause to streamline the process. By reducing resolution time, you can improve customer satisfaction and ensure that issues are resolved promptly.
A manufacturing company can use a Power BI service desk dashboard to manage service desk operations for its production facilities. By tracking resolution time, the service desk team can identify bottlenecks in the production process caused by service desk issues. For example, if a machine downtime ticket takes longer to resolve, it could indicate a critical production delay. By addressing these issues promptly, the company can minimize downtime and maintain optimal production efficiency.
3. First Response Time
First response time tracks the average time taken to respond to a new ticket. A fast first response time is crucial for customer satisfaction, as it demonstrates that you are attentive to their needs. Delays in responding to tickets can lead to frustration and dissatisfaction among customers. By monitoring first response time, you can identify areas where your team can improve their responsiveness, such as implementing automated ticket routing or providing additional training to team members.
A retail chain can use a Power BI service desk dashboard to manage service desk operations for its stores. By tracking the first response time, the service desk team can ensure that store employees receive timely support for service desk issues. For example, if a store experiences a point-of-sale system outage, a fast first response time ensures that the issue is addressed promptly, minimizing the impact on sales and customer satisfaction.
4. Customer Satisfaction Score
This metric measures the feedback from customers on the quality of your service. CSAT is typically collected through post-interaction surveys or feedback forms. A high CSAT score indicates that your team is meeting or exceeding customer expectations, while a low score may indicate areas for improvement. By analyzing CSAT scores, you can identify trends and patterns in customer satisfaction and take proactive steps to address any issues.
A university uses a Power BI service desk dashboard to manage service desk operations for its students, faculty, and staff. By tracking CSAT scores, the service desk team can measure satisfaction levels and identify areas for improvement. For example, if students consistently rate the service desk support as low, it may indicate a need for additional training or resources to improve the quality of service desk services.
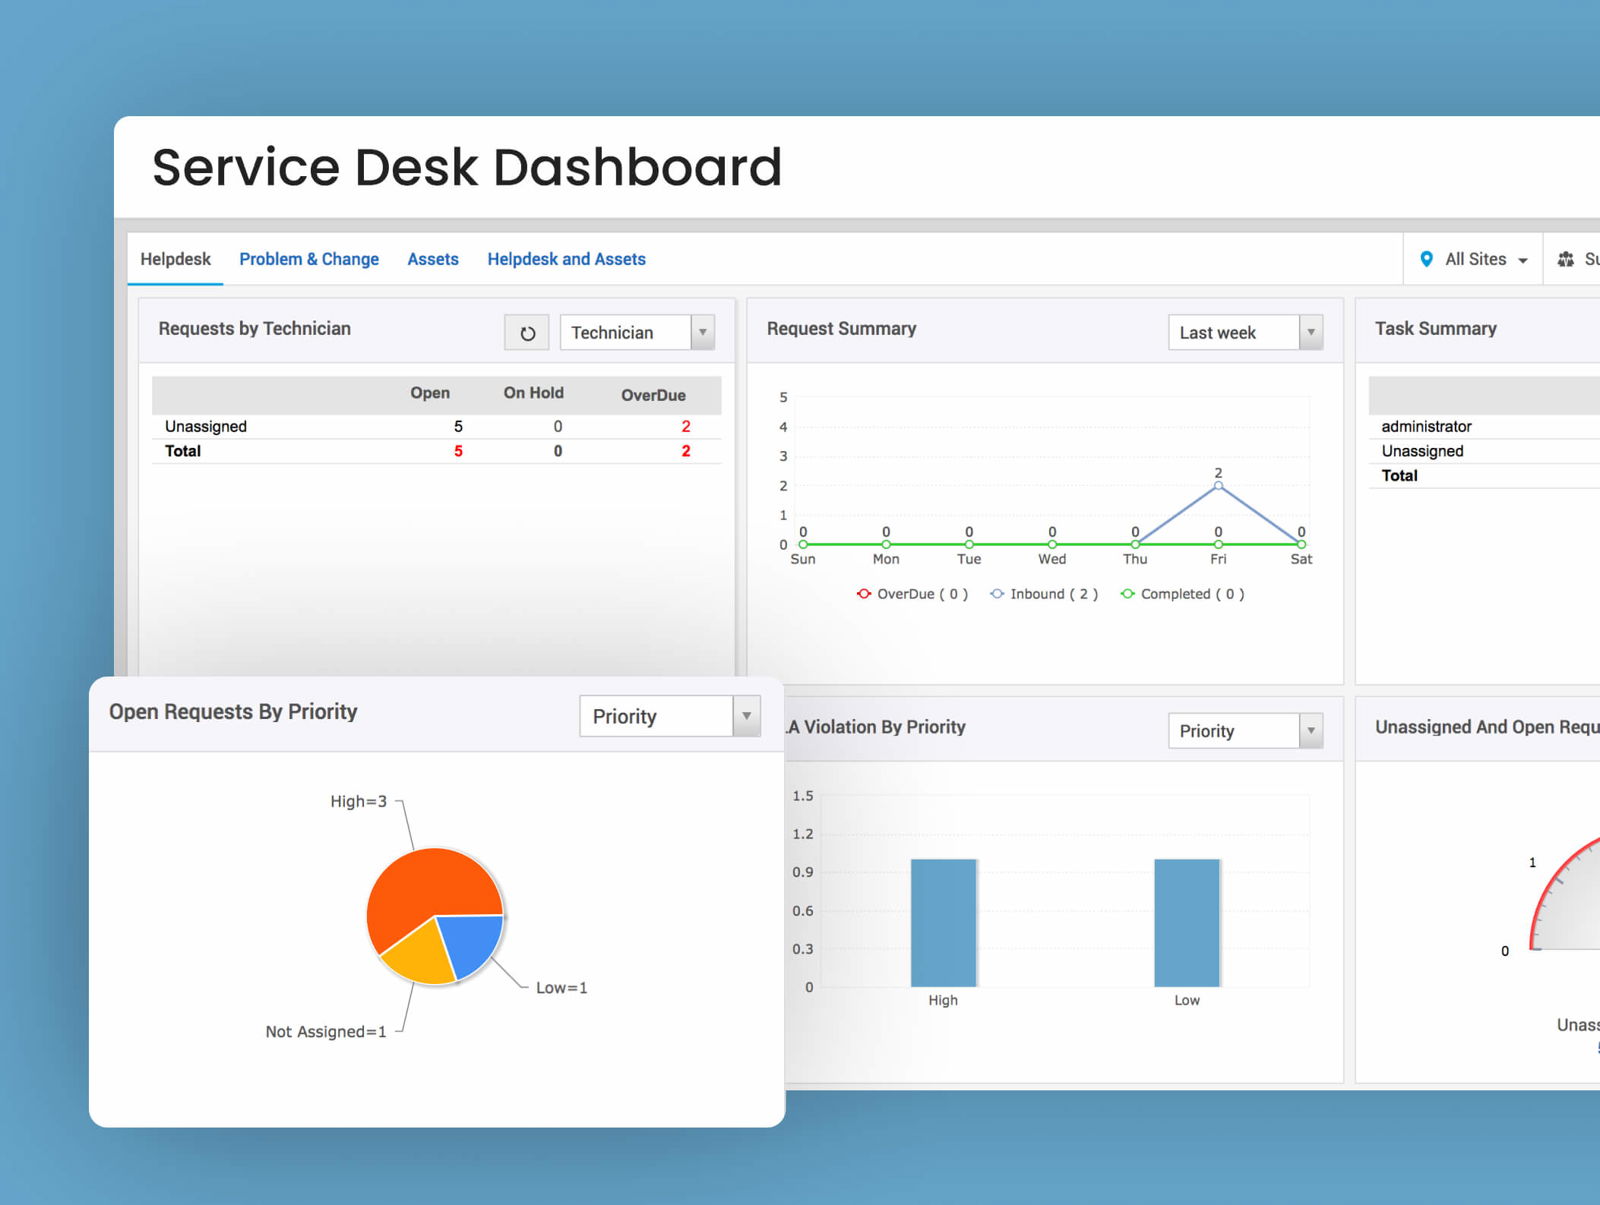
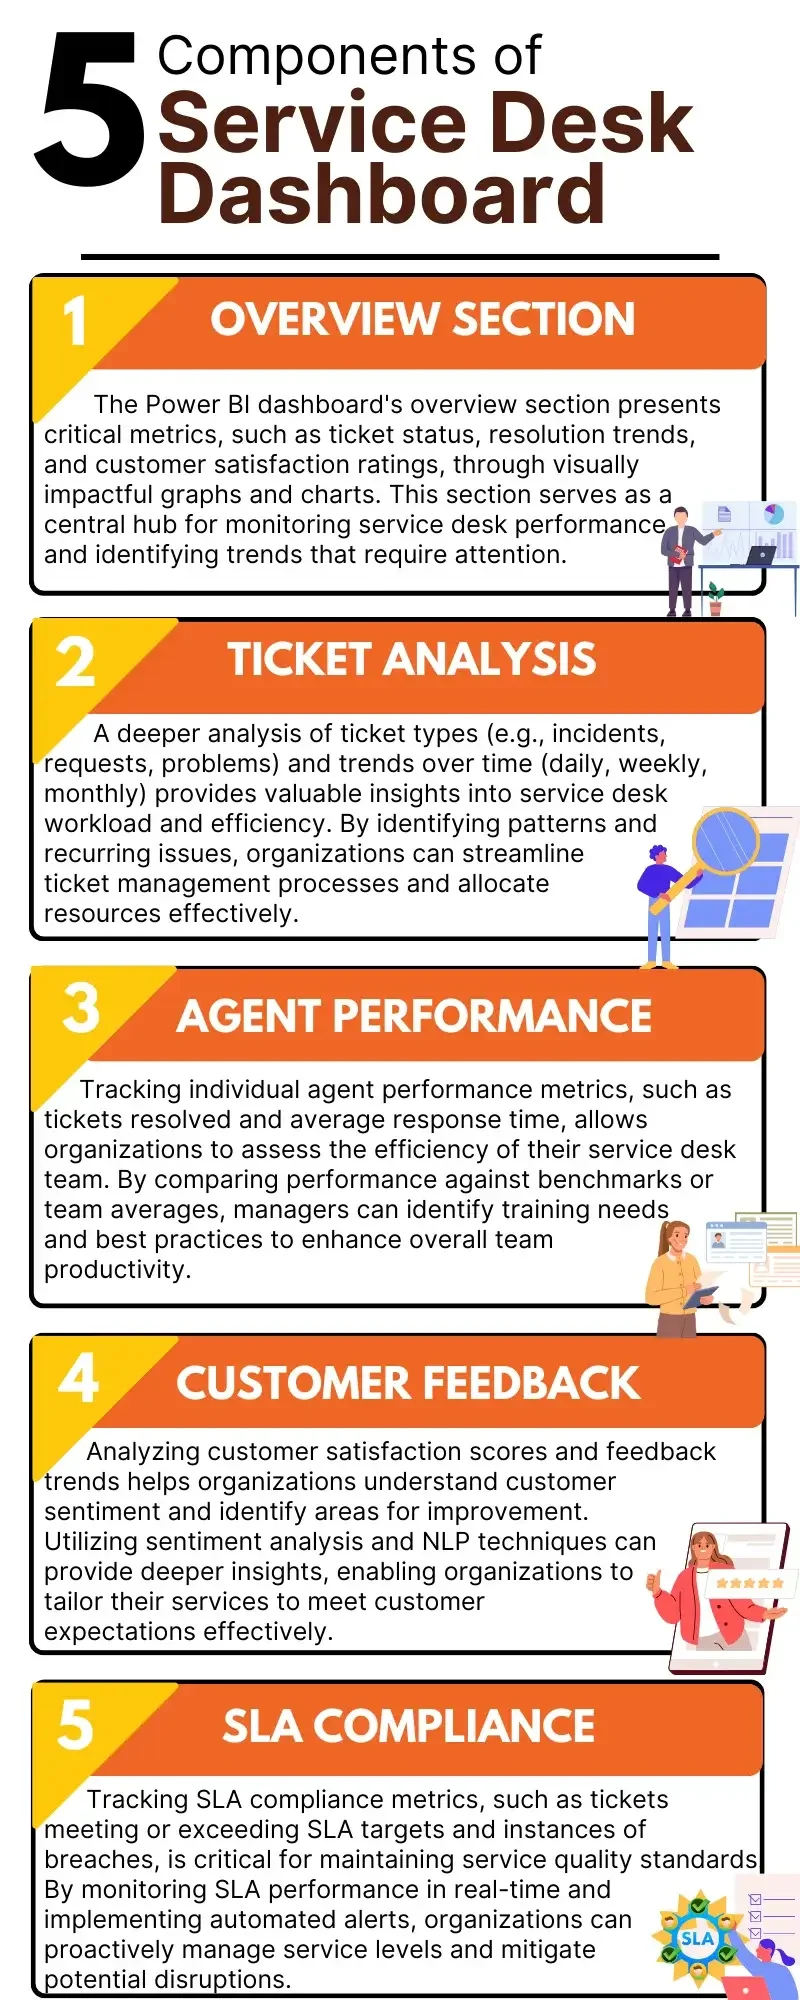
The Blueprint of Efficiency: Components of Your Service Desk Dashboard
Managing a service desk efficiently requires tracking key metrics that provide insights into your team’s performance and customer satisfaction. Including these metrics in your Power BI service desk dashboard can help you make informed decisions and improve the overall effectiveness of your support operations. Here are four essential metrics to include:
Power Up Your Business Intelligence with Power BI
Turn complexity into clarity with our user-friendly Power BI solutions.
Customization and Interactivity in Service Desk Power BI Dashboard
Service desk operations rely heavily on data to ensure efficient customer support and issue resolution. Power BI dashboards offer a range of customization and interactivity features that can significantly enhance the monitoring and management of service desk activities. Let’s explore some key elements that make Power BI dashboards ideal for service desk operations:
1. Flexible Data Filtering
Power BI allows users to filter data dynamically based on various criteria such as date, agent, ticket type, and more. This flexibility enables service desk managers to focus on specific time periods, individual agents, or particular types of tickets for in-depth analysis and decision-making.
2. Drill-Down Capabilities
Drill-down features in Microsoft Power BI enable users to delve deeper into the data, revealing detailed insights and trends. Service desk managers can analyze specific metrics such as ticket resolution times, agent performance, or customer satisfaction scores at a granular level, helping them identify areas for improvement and optimize service delivery.
3. Personalized Dashboards
Power BI service desk dashboard allows for the creation of personalized dashboards tailored to different user roles within the service desk ecosystem. Agents, managers, and executives can have customized views that highlight the metrics and KPIs most relevant to their roles, ensuring that each user receives the information they need to perform their duties effectively.
4. Seamless Data Integration
One of the key strengths of Microsoft Power BI is its ability to integrate with various data sources, including service desk software, CRM systems, and other business applications. This integration provides a comprehensive view of service desk operations, allowing for better-informed decision-making and more effective resource allocation.
Benefits of Power BI Service Desk Dashboard: How the Dashboard Enhances Efficiency
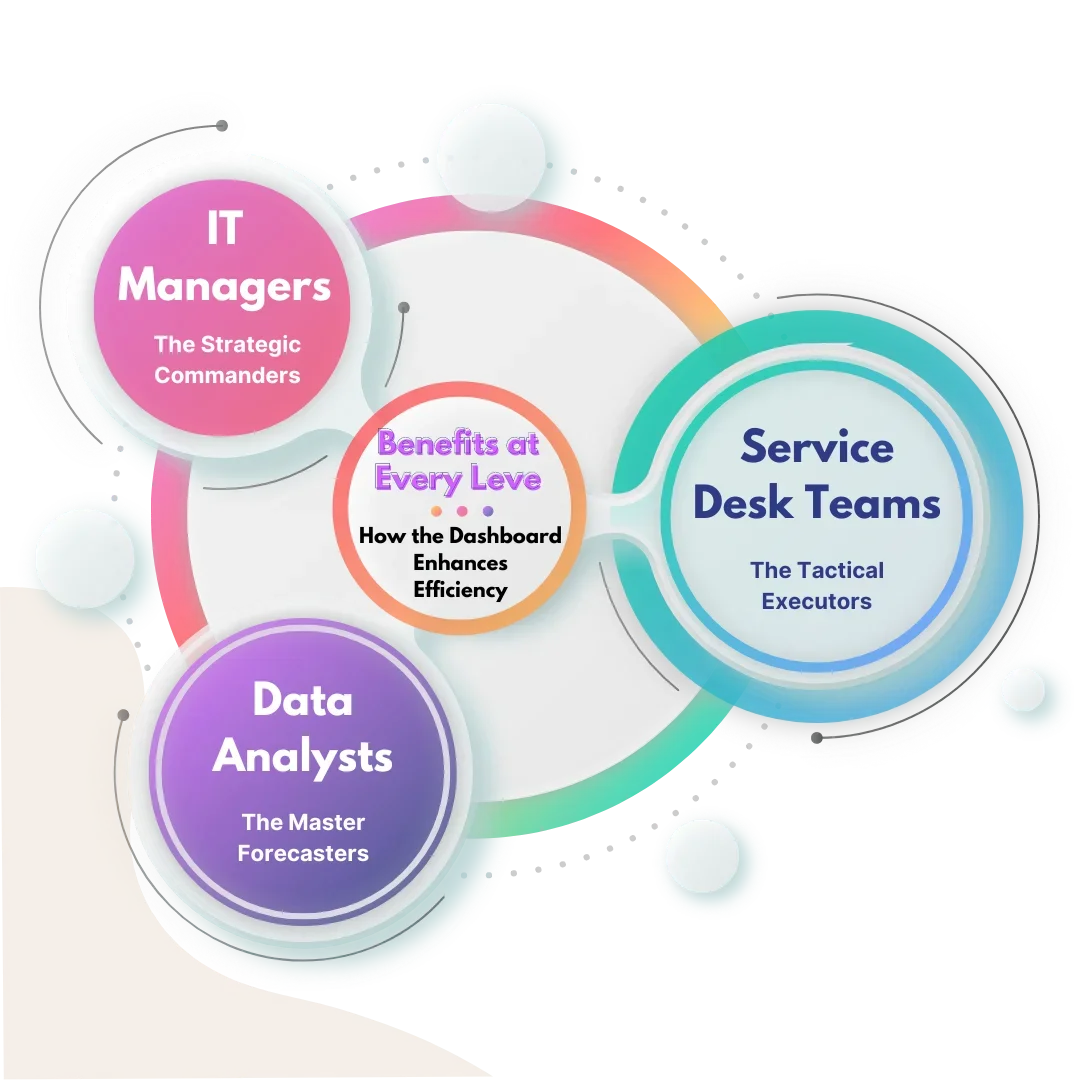
The fast-moving environment of modern business is the ultimate indicator of the importance of dashboards for supply chain/operation efficiency. Such platforms allow immediate access to data and hence the possibility for the instant analysis of the information and implementation of quick decisions. Let’s explore how dashboards redefine efficiency for different organizational roles:
1. IT Managers: The Strategic Commanders
To steer the IT ship strategically, managers will use the dashboard to give them a 360° view of their IT systems landscape. These tools provide immediate feedback on the network sprint, security threat, and resource distribution. Equipped with this information, IT managers can anticipate problems, reconfigure, allocate resources wisely, as well as make overall IT operations trouble-free.
2. Service Desk Teams: The Tactical Executors
Service desk teams are the operational backbone, efficiently resolving user issues. Through the available dashboards, they can get a clear picture of the number of tickets that have been registered, how long they have taken to be resolved, and what the average performance of the individuals involved is. This visibility enables the team to prioritize the tasks properly, ensure quick service, and improve the overall customer relationship.
3. Data Analysts: The Master Forecasters
As data analysts are the designers of data-driven knowledge, the dashboard is their building block. They provide a unified aircraft for understanding and investigating the available data, as well as visualization. Through data exploration and merging the analytics extracts actionable insights, data analysts incrementally boost the effectiveness of activities, foster innovation, and guide the organization toward sustained development.
Conclusion
The Power BI Service Desk Dashboard is like a beautiful map combined with intelligent navigation, enabling your service desk to navigate to a real-time diagnosis of the status quo and to find the optimal route for flying on a clear wind through the competitive atmosphere of IT services. Whatever you focus on, whether it is to improve operations, response time, or customer satisfaction, the Power BI Service Desk Dashboard functions as the tool that grants you an all-knowing view into all the IT service functions.
Ready to transform the service desk operations? Sunflower Lab is here to help your business with our Power BI experts. Our solutions not only function effectively but also transform data into actionable insights that drive decision-making. The analytics of your service desk are ready for adoption, all you need is a reliable Power BI development company. Contact us and explore the path to Power BI development services today!
Our Power BI Solutions
Drive Success with Our Tech Expertise
Unlock the potential of your business with our range of tech solutions. From RPA to data analytics and AI/ML services, we offer tailored expertise to drive success. Explore innovation, optimize efficiency, and shape the future of your business. Connect with us today and take the first step towards transformative growth.
You might also like
Stay ahead in tech with Sunflower Lab’s curated blogs, sorted by technology type. From AI to Digital Products, explore cutting-edge developments in our insightful, categorized collection. Dive in and stay informed about the ever-evolving digital landscape with Sunflower Lab.