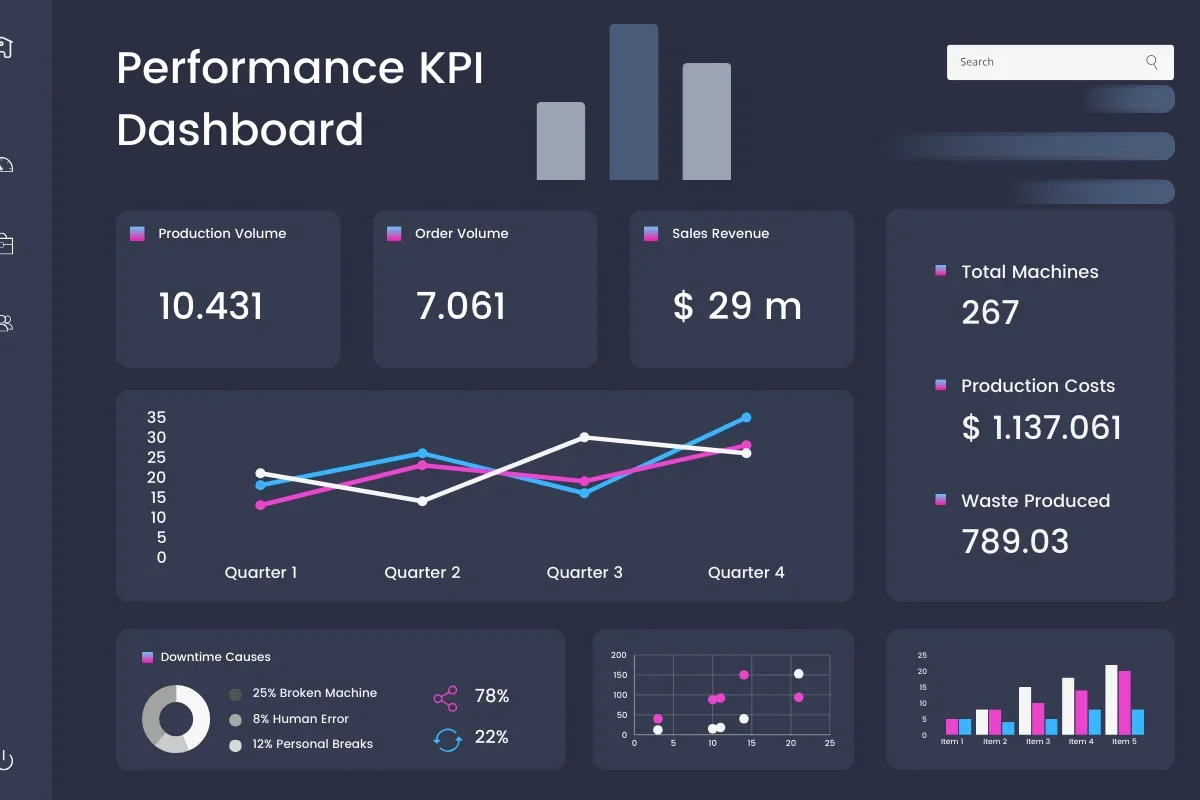
Microsoft Business Intelligence and Data Analytics
Helping businesses extract meaningful insights from their data.
Your idea is 100% protected by our Non-Disclosure Agreement
Driving your Business Decisions with Data
- Personalize the customer experience
- nform business decision-making
- Streamline operations
- Mitigate risk and handle setbacks
- Enhance security
- Anticipate needs/changes before they arise
Our Data Analytics services maximize the value of information and helps create data-driven systems for the future. We leverage Microsoft Power BI or Tableau to create efficient and practical analytics solutions to suit every business. These tools turn your raw data in to visual representations, which translate into important knowledge about the health of your business, trends in your industry, and potential problems you may encounter. We can help you understand your data so you can unlock the many benefits of data analytics.
Sunflower Lab
intelligent
business software
Our Data Analytics Partners
We utilize the analytical power of Microsoft BI and Tableau to help organization uncover insights hidden in their data. Partnering with these industry-leading data analytics companies allows us to deliver a perfectly-crafted data management system for your company.
Microsoft Power BI
GMicrosoft Power BI is data analytics software that turns your unrelated sources of data into coherent, immersive, and interactive data visualization. As experts in Microsoft business intelligence, we help organizations adopt and manage their Power BI system for error-free business decision-making.
Tableau
Tableau is a fast-growing data visualization tool used transform data into understandable business insights. We tailor Tableau solutions to help companies accelerate everyday reporting and decision making, regardless of technical savviness.
Sunflower Lab’s Data & Analytics Services
Our data analytics consultants start off by analyzing your current business environment. We then identify a suitable data analytics software and develop a strategy that aligns with your data and analytics goals.
We equip our clients with a variety of visual elements like charts, graphs, maps, and tables to represent their data in an easy-to-understand way. We also ensure these visual elements are easy to modify per the client’s evolving needs.
Data preparation allows us to manipulate your erroneous data into a form that can be easily and accurately analyzed for data-driven business purposes.
Lastly, data analytics uncovers useful information that helps businessowners make decisions with confidence, solve various challenges, forecast future trends, and realize the full potential of their data.
Knowledge is Power
Business intelligence, or BI, prioritizes data involving the past and current state of your business. BI answers questions like, “What happened?” and “What was the trend?” Business analytics/Data analytics refers to the practice of using data to make predictions and develop future strategies for growth. Business analytics answers the questions of, “Where is the trend going?” and “What will happen next?” When combined together, BI and BA paint a full picture of the past, present, and future of your company. Armed with this information, you are capable of making decisions that will transform your organization into the informed, agile, and unstoppable business of your dreams.
Business Success
Visual Learners
Your data is only as good as how you present it. Data visualization is the process of turning your information into visual representations that people can easily understand. Tools like charts, graphs, and maps give your data necessary context so that trends, outliers, and patters are easily comprehended. Not only are visualizations able to communicate what your data actually means, they also make your insights memorable for lasting impact.
Business Success
Frequently Asked Questions
The cost of data analytics for your business depends on many factors including organization size, desired features, number of licenses, and amount of data among others. That being said, Microsoft Power BI can cost anywhere from $9.99 per user per month to $4,995 per month. Tableau costs start at $70 per user per month.
The time required for an analytics project is dependent on a number of factors like the scope and scale of the project, readiness and availability of required data, and approval from the management team. Each data analytics project will come with its own custom timeline ranging from weeks to months. Contact us for a free quote.
A good data and analytics strategy must include answers to the following questions:
• Who are consumers of analytics?
• How you will source and gather the data?
• How that data will be turned into insights?
• What are your technology infrastructure requirements?
• What are your organizational data competencies?
• Who will govern the data?
To learn more about answering these questions, Click here
Your data will be the lifeblood of your data analytics system. And depending on what questions you want your data to answer, you should have a collection of data including:
Customer data: contact info, purchase behavior, purchase history
Financial data: revenue, operational costs, cashflow
Marketing data: geographical info, age, income