Unlike other industries, manufacturing industries are always searching for innovative ways to improve their efficiency and productivity. One of the biggest challenges they face in achieving their true potential is the overwhelming amount of data generated daily that remains unused.
Did you know that between 60% to 73% of enterprise data remains unused for analytics, with the manufacturing industry being the biggest contributor to it?
This huge amount of data, if not used or managed effectively, can lead to inefficiencies, missed opportunities, and increased costs. Not only that, Manufacturers often struggle with:
- Manual data collection and reporting processes,
- Which are not only time-consuming but also prone to errors.
Moreover, with the increasing complexity of manufacturing processes and supply chains, there is a growing need for real-time insights to optimize operations and improve overall performance.
All of these problems can be solved with just one tool, Power BI dashboard. With Power BI development services, you can maximize efficiency and ROI, ensuring no important data goes unused. Power BI dashboard development services will help you join the troop of manufacturers who have seen a 15% growth with Power BI integration.
Challenges in Data Management in Manufacturing
In the manufacturing industry, managing and analyzing large volumes of data poses several challenges. One major hurdle is the sheer volume of data generated by various processes and systems, making it difficult for manufacturers to effectively process and derive meaningful insights. Traditional data tracking methods, such as spreadsheets and manual reporting, are often inadequate for handling this massive amount of data.
This is where Power BI comes in, offering a way to manage and analyze data more effectively.
- Volume of Data: Think about it, managing and analyzing all that data is a big challenge for manufacturers.
- Traditional Methods: Many rely on spreadsheets and manual reporting, but they just don’t cut it anymore.
- Limitations: They’re slow, prone to errors, and don’t give real-time insights.
One big problem with these traditional methods is the potential for human error. One wrong entry can throw off your entire analysis, leading to inefficiencies and higher costs.
- Human Error: These methods are prone to mistakes, which can really mess up your data analysis.
- Inefficiencies: This can lead to inefficiencies in your processes and missed opportunities for improvement.
Another issue is scalability. As your manufacturing operations grow, spreadsheets and manual reporting become more of a hassle than a help.
- Scalability: They just can’t keep up as your operations get bigger and more complex.
And let’s not forget about integration. Traditional methods often struggle to combine data from different sources, which can leave you with a fragmented view of your operations.
- Integration: They have a hard time pulling data together from different places, making it tough to see the big picture.
To tackle these challenges, many manufacturers are turning to modern tools like Power BI. It offers advanced features for managing and analyzing data, giving you the insights you need to make smarter decisions and improve your operations.
Power Up Your Business Intelligence with Power BI
Turn complexity into clarity with our user-friendly Power BI solutions.
Reasons Why the Manufacturing Industry Should Use Power BI Dashboard
What if you run a manufacturing business without knowing how efficiently your machines are running, how much inventory you are left with, or things like how well your supply chain is performing? This whole scenario resembles a situation like driving a car blindfolded, you wouldn’t know where you’re going or how to reach your destination.
Removing the blindfold will give you a clear view of your path. Just like that, a Power BI dashboard will help you navigate and make sense of all of the data your business generates. All you have to do is hire a Power BI expert for your manufacturing industry.
Role in Data Analytics:
- Power BI Dashboard is your personal data analyst, helping you create interactive dashboards and reports that show you exactly what’s going on in your business.
- Whether you’re tracking production efficiency, monitoring inventory levels, or analyzing your supply chain performance, Power BI Dashboard covers all.
In any industry, including manufacturing, enterprises that weigh informed insights make strategic decisions that steer them through obstacles, capitalize on openings, and successfully attain their objectives.
But how do Power BI dashboards help manufacturers gain insights for their businesses?
- Real-time Data Visualization: With Power BI Dashboard, you can see your data in real-time, allowing you to spot issues as soon as they arise and take action immediately.
- Predictive Analytics: Power BI Dashboard can help you forecast demand, optimize your production schedules, and reduce waste, saving you time and money.
- Customizable Dashboards: You can create custom dashboards that focus on the metrics that matter most to you, giving you a clear view of how your business is performing and where you can improve.
Benefits of Power BI Dashboard in Manufacturing
Using Microsoft Power BI services, manufacturers can create dynamic dashboards that are specifically designed to satisfy their requirements. The platform can be used to measure the KPIs, monitor production lines, or analyze quality control data and in this way provides a view personalized enough to make a snap judgment about the situation.
These custom dashboards help the decision-makers detect obstacles and determine areas that need improvement, ultimately leading to continuous improvement. Here is a complete description of the broad benefits offered by the Power BI dashboard in manufacturing.
1. Centralized Data Visualization
Issue: Data fragmentation in manufacturing operations hampers effective analysis and slows down decision-making.
Solution: Power BI dashboard in manufacturing industry consolidate data from different systems into a single, easy-to-view interface.
Result: Stakeholders can derive well-rounded insights without spending time on data bickering.
2. Makes understanding Analytics Easy
Issue: Some manufacturing personnel lack the skills to analyze specific data, leading to difficulties in deriving useful insights.
Solution: Power BI presents complex analysis processes through visually captivating charts and plots.
Result: Users at all levels can understand data effortlessly.
3. Real-Time Monitoring and Analysis
Issue: Traditional reporting methods rely on static reports, resulting in outdated information and missed opportunities.
Solution: Power BI provides real-time insights into production processes and inventory levels.
Result: Manufacturing can react timely to interventions for operational efficiency and issue resolution.
4. Predictive Analytics
Issue: The manufacturing industry needs to foresee future trends for demand forecasting, inventory management, and operational requirements.
Solution: Power BI’s predictive analysis applies advanced algorithms to historical data to find patterns for future trend planning.
Result: Manufacturers can plan for future trends to ensure minimal disruptions and maximum operational efficiency.
5. Demand Forecasting
Issue: Inaccurate production planning and inventory management due to fluctuating market demands and unforeseen disruptions.
Solution: Power Bl uses strong analytical tools to analyze historical data, market trends, and external factors for accurate demand projections.
Result: Manufacturers can optimize resource allocation and ensure adequate inventory levels.
6. Collaboration and Accessibility
Issue: Data access restrictions in traditional manufacturing environments impede cooperation and decision-making.
Solution: Power BI’s cloud-based platform allows stakeholders to view dashboards from anywhere, supporting seamless collaboration.
Result: Improved cooperation and decision-making across departments and geographical locations.
Types of Power BI Dashboards that will Improve Your Manufacturing Efficiency
Power BI dashboards go beyond functionality to handle every gear and wheel in the production process. From the Power BI inventory dashboard and supply chain Power BI dashboard to manufacturing, quality control, and distribution, the dashboards provide specific data tracking and analysis modules to assist in simplifying operations. Some of the important forms of Power BI dashboards for increasing industrial efficiency are:
1. Power BI Dashboard for Measuring Production Efficiency
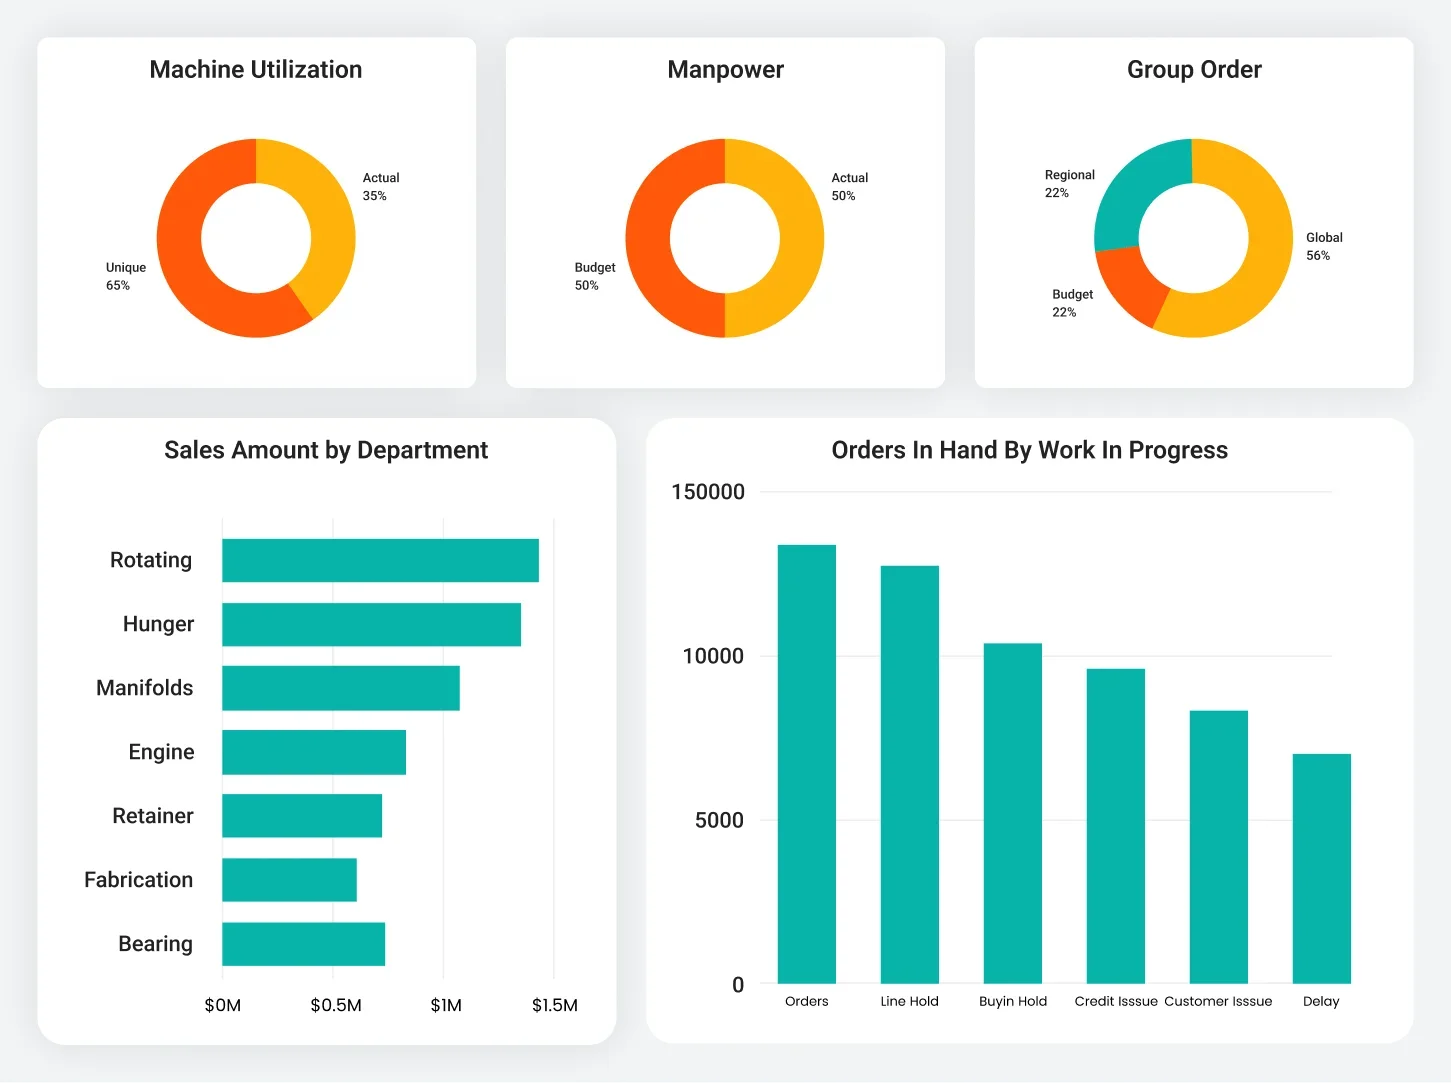
The Power BI Dashboard for production efficiency monitors key performance indicators (KPIs) in manufacturing. It visually presents crucial metrics like:
- Cycle Time Monitoring: Tracks average production time per product to identify bottlenecks.
- Throughput Analysis: Measures output rate per unit of time for overall process efficiency.
- Downtime Tracking: Displays machine downtime to pinpoint areas for improvement.
Fairlife, a dairy company, used the dashboard to reduce downtime by proactively addressing equipment issues. Their visually appealing reports also provided insights into their performance compared to competitors. The easy-to-understand design of this dashboard allows stakeholders to track performance and identify improvement areas easily.
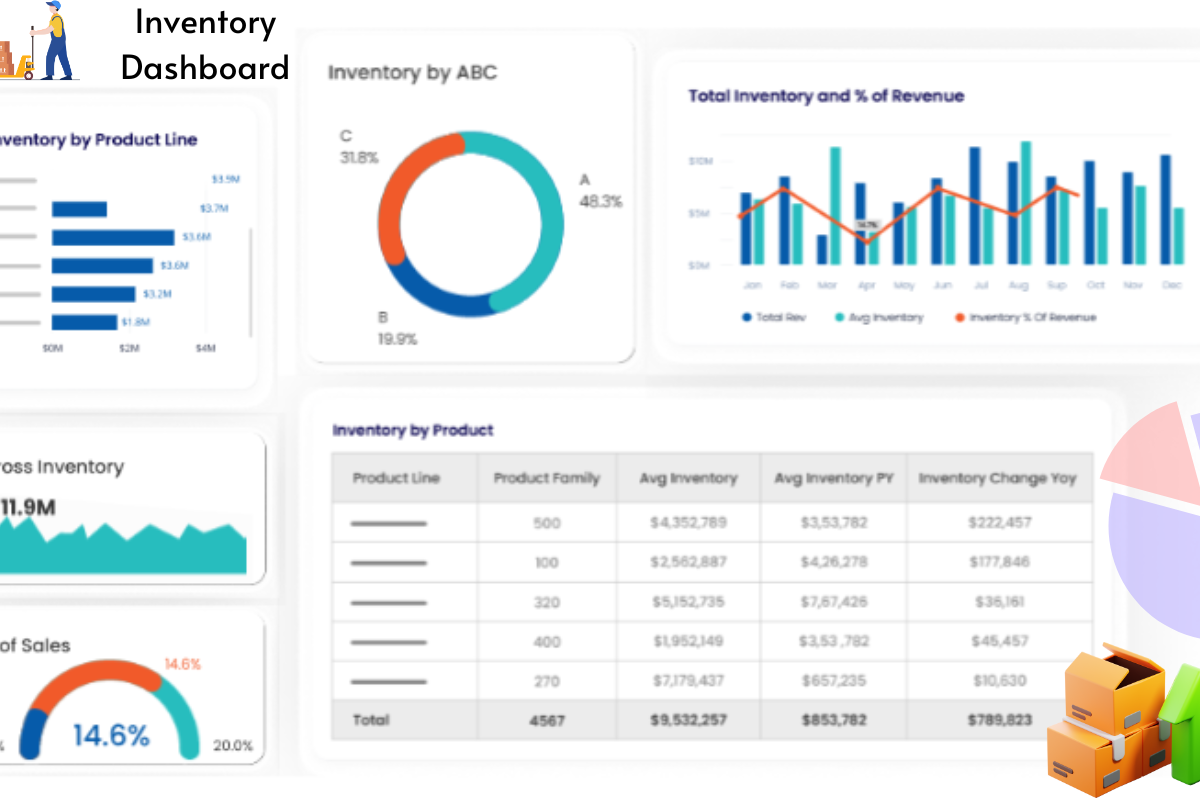
2. Inventory Management With Power BI Dashboard
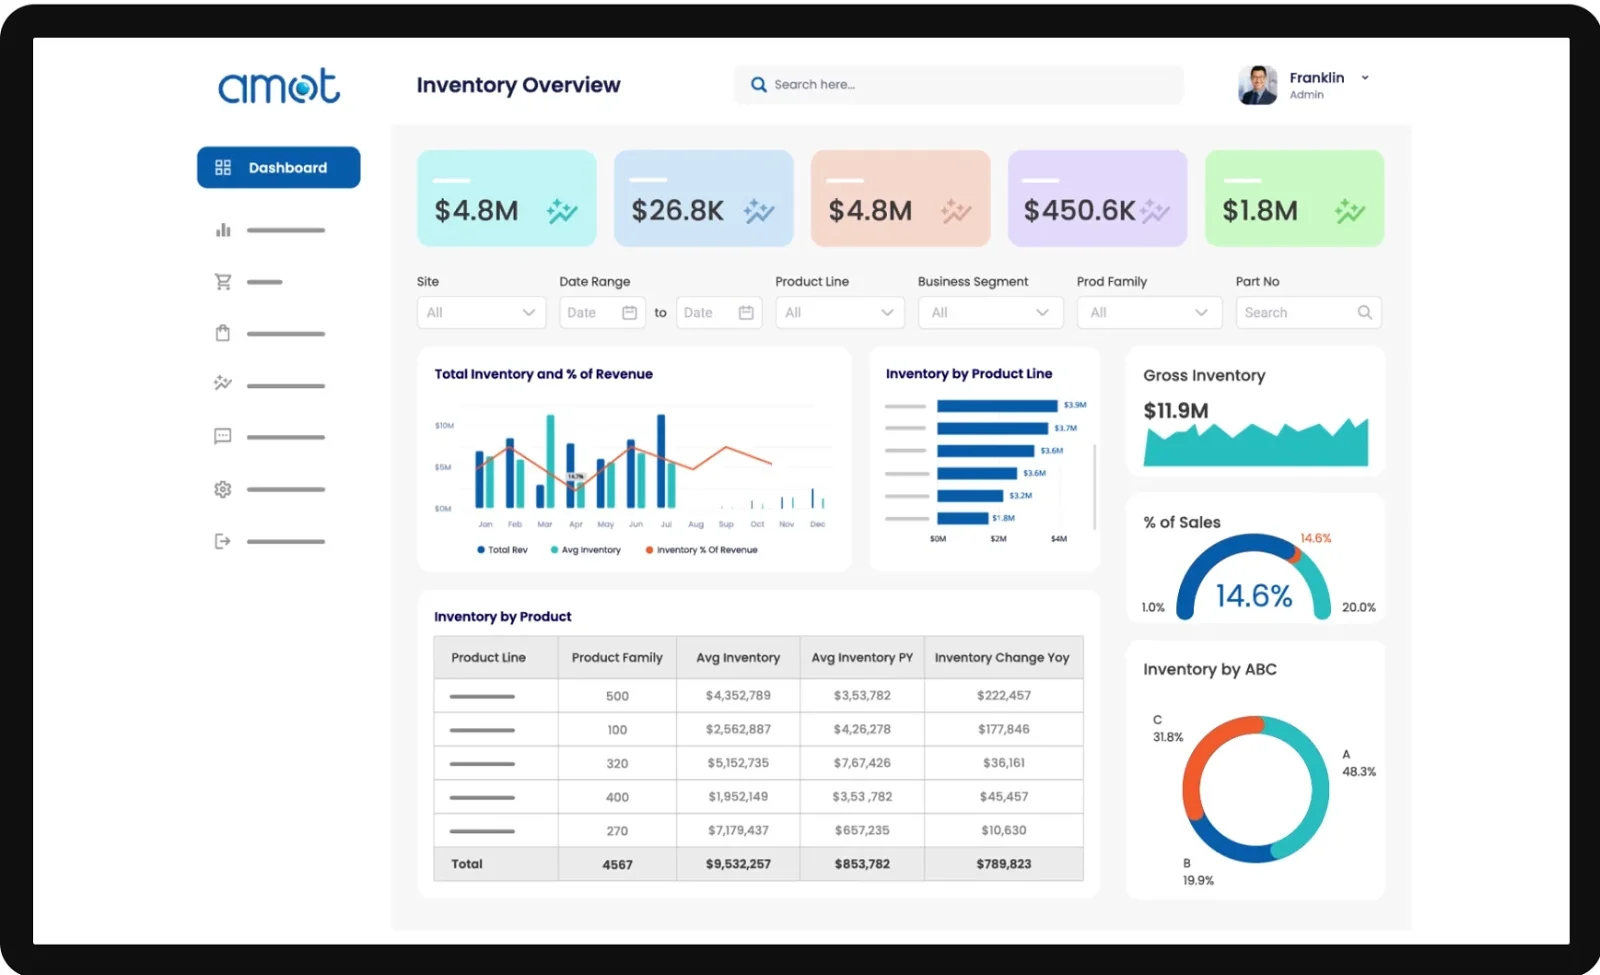
The Inventory Management Power BI Dashboard provides manufacturers with a comprehensive view of their inventory, including:
- Visibility: Allows tracking of existing inventory levels and stock levels for raw materials, work-in-progress, and finished goods.
- Fluctuation Detection: Identifies fluctuations in inventory turnover, helping to pinpoint potential stockouts or surplus stocks.
- Real-time Monitoring: Provides real-time inventory and backlog monitoring, crucial for preventing operational disruptions.
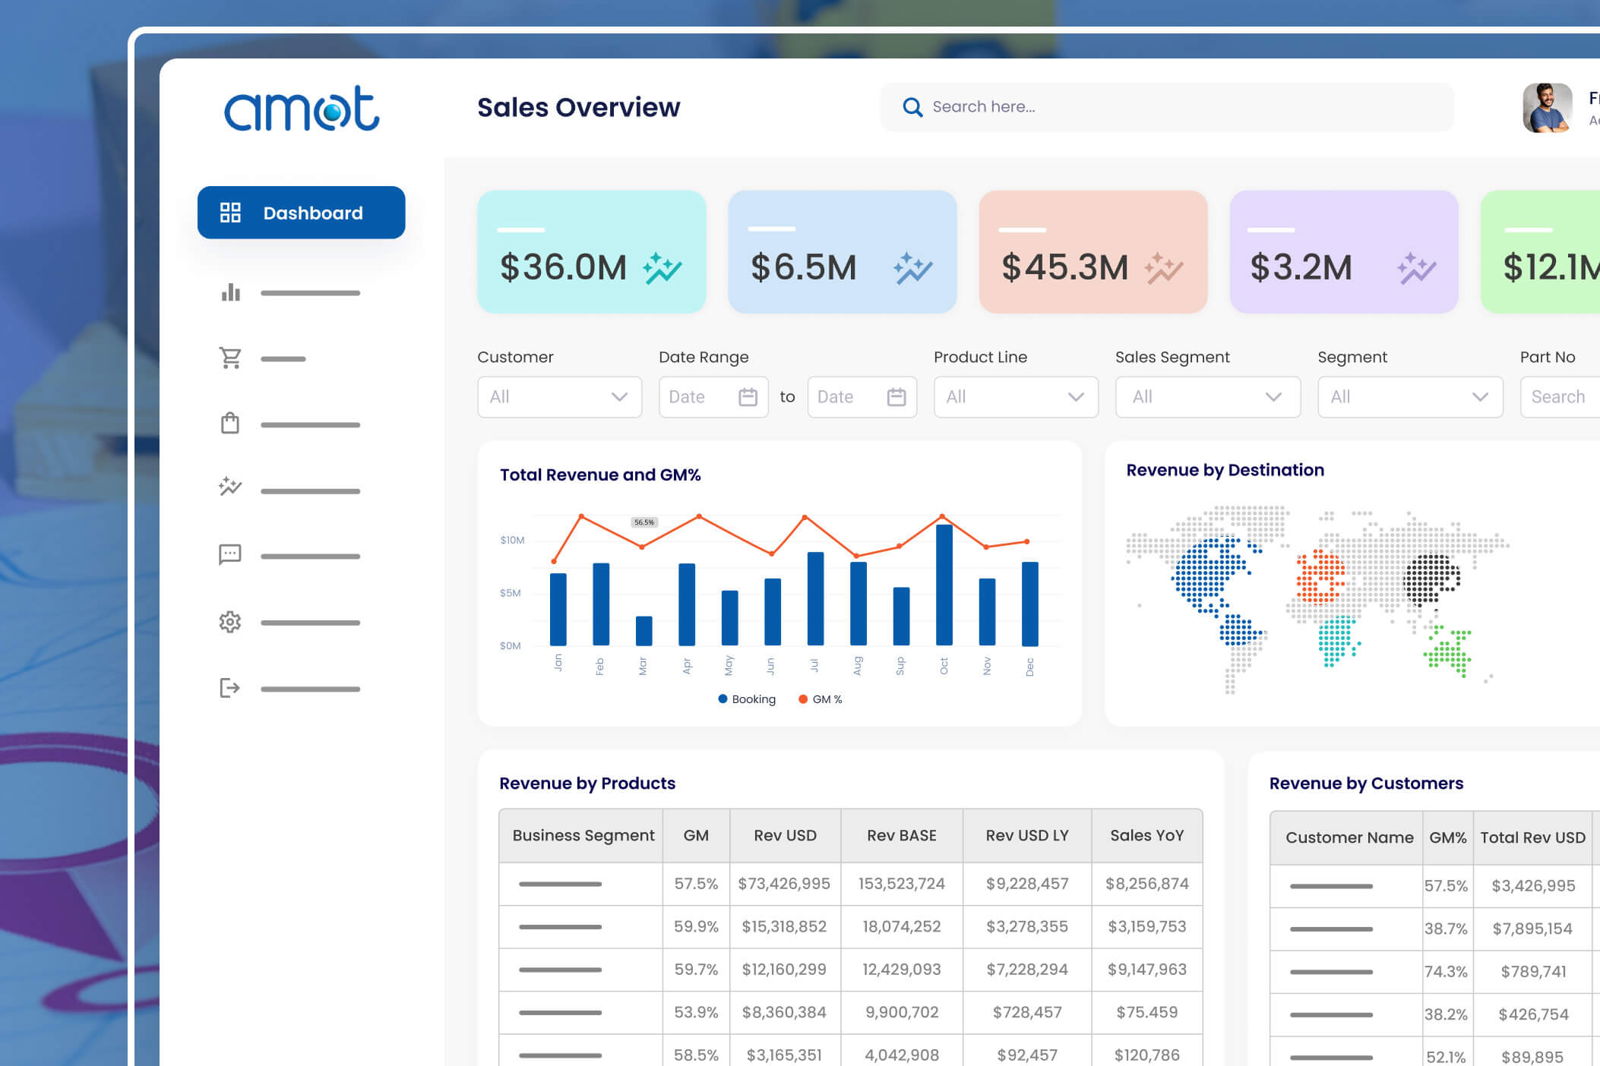
AMOT, a manufacturer of industrial valves, needed real-time inventory, and backlog monitoring. For this issue they turned to Power BI Dashboard and reached out to Sunflower Lab for a dynamic dashboard model, powered by real-time data and predictive forecasting, offering AMOT a holistic view of their stock levels and order pipeline.
This solution enables AMOT to:
- Optimize Production: Based on actual demand, minimizing stockouts and addressing potential backlogs proactively.
- Ensure Smooth Operations: Empowering them to achieve uninterrupted production and maintain customer satisfaction.
3. Dashboard for Quality Control
The Power BI quality control dashboard maintains product integrity and customer satisfaction by giving important quality metrics insights. The system tracks indicators, enabling manufacturers to monitor quality trends and intervene before any problems happen. Key Indicators:
- Defect Rates: Monitors the percentage of defective products in each batch.
- Rework Percentages: Tracks the amount of rework needed per product batch.
- Customer Complaints: Records and analyzes customer feedback regarding product quality.
For instance, the dashboard may reveal a rise in defect rates for a specific product category, which triggers an investigation by quality control teams into the root cause, such as a bad batch of raw materials or a procedure deviation during production.
In real-time, this Power BI manufacturing dashboard uses data visualization and trending to implement stringent quality standards and avoid the risk of poor-quality products.
4. Check Overall Maintenance Using the Power BI Dashboard
An equipment breakdown can disrupt manufacturing processes, resulting in lost productivity and profit. The Power BI maintenance dashboard gives manufacturers an edge in the adoption of predictive maintenance methods and minimizing unexpected failures.
Organizations can track essential upkeep metrics such as:
- Equipment Uptime: Monitor the percentage of time equipment is operational.
- Mean Time Between Failures (MTBF): Calculate the average time equipment operates between failures.
- Maintenance Schedules: Plan and track maintenance activities to ensure equipment reliability.
This data allows companies to foresee potential issues and schedule preventive maintenance procedures as required.
For example, a Power BI manufacturing dashboard may display:
- Upcoming Equipment Failures: Based on performance trends, informing the maintenance team to act before a breakdown.
- Past Repair Data: Reviewing repair data and charges to improve repair schedules, manage resources efficiently, and reduce maintenance expenses.
5. Power BI for Supply Chain Analytics
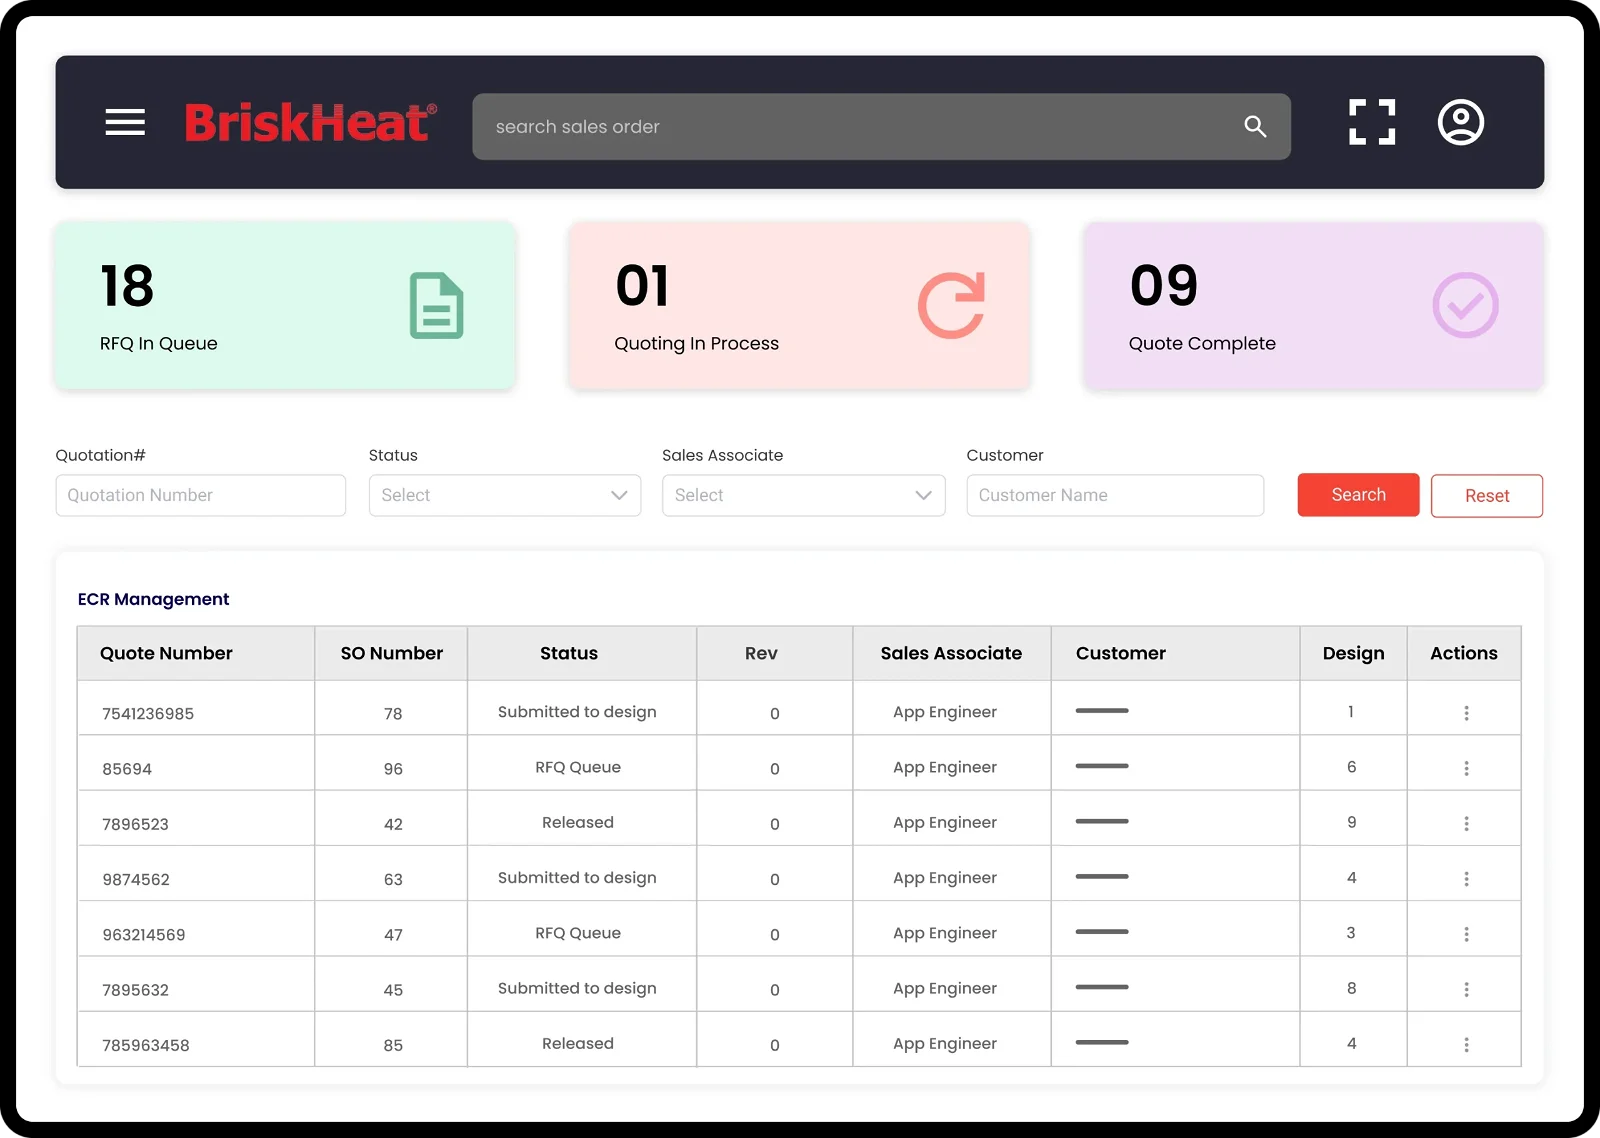
The supply chain is at the core of manufacturing, which is a complicated network composed of suppliers, distributors, and logistics. Manufacturers can track supplier reliability, inventory levels, and production schedules, thus enabling them to proactively make decisions aimed at reducing disruptions. It features:
- Current Information Access: Real-time data on supplier reliability, inventory levels, and production schedules.
- Status Updates: The dashboard allows for easy updates on production statuses and quotation tracking.
- Efficient Collaboration: Enhances collaboration between internal teams and customers through streamlined information sharing.
Briskheat, a leading heating specialist, faced the challenge of managing increasing orders with manual quotation tracking, leading to errors and delays. However, with the help of dashboards, their digital specialists transformed their operations.
Now, engineers can effortlessly access real-time information, update statuses, and track quotations with a simple click. This not only simplified their supply chain management but also enhanced collaboration between internal teams and customers.
6. Reducing Energy Consumption with Power BI
Energy consumption is a significant cost factor in manufacturing, making it crucial for businesses to optimize their energy usage. The Power BI Energy Consumption Dashboard provides manufacturers with valuable insights into their energy usage patterns, costs, and opportunities for sustainability improvements.
It includes key features like:
- Up-to-date Visualization: The dashboard visualizes data from utility meters, production processes, and facility operations in real time, enabling users to monitor energy usage trends and identify areas for optimization.
- Cost Analysis: It provides a detailed cost analysis of energy consumption, helping manufacturers understand the financial impact of their energy usage and identify opportunities for cost savings.
- Sustainability Measures: The dashboard offers insights into sustainability measures, such as reducing carbon footprint and aligning with environmental targets, helping businesses enhance their sustainability performance.
For example, the dashboard may also indicate the need to tweak equipment settings, reschedule production at off-peak rates, or invest in energy-efficient solutions. With insights from the energy consumption dashboard, manufacturers can reduce costs, enhance sustainability performance, and align with environmental targets.
7. Dashboard for Compliance and Regulatory
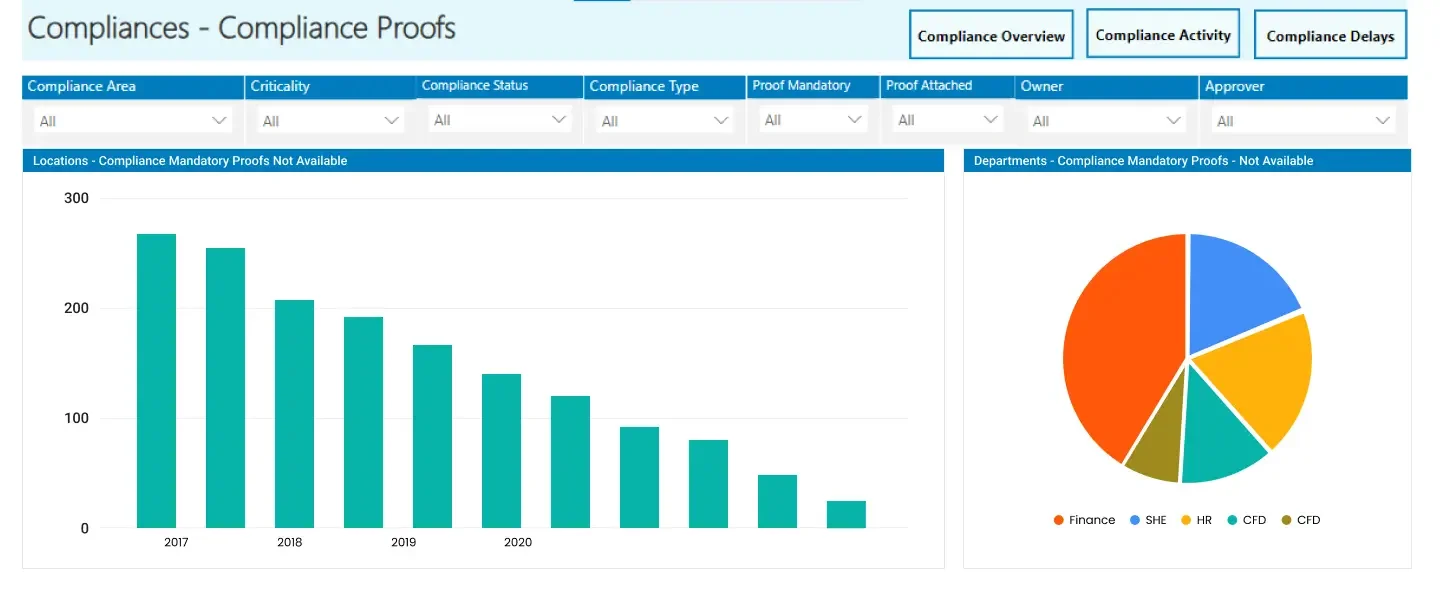
Full adherence to industry regulations and standards is essential for manufacturing companies to provide quality, safe, and legally approved products. The Compliance and Regulatory Power BI dashboard provides a bird’s-eye view of all the regulatory requirements, audits, and statuses on compliance.
- Number of Noncompliances: Monitor the total count of regulatory noncompliances to address them promptly.
- Audit Findings: Track and analyze audit findings to ensure compliance with standards.
- Quality Standards Agreement: Monitor the agreement to quality standards to maintain product quality.
This manufacturing Power BI dashboard helps monitor compliance with Occupational Safety and Health Administration (OSHA) standards, environmental regulations, and product quality standards. Regular tracking of these metrics enables manufacturers to take proactive measures, ensure compliance, prevent risks, and build a reputation as a trusted industry member.
8. Power BI Sales and Operations Planning (S&OP) Dashboard
The dashboard for Sales and Operations Planning (S&OP) integrates crucial business data to facilitate informed decision-making. It connects sales forecasts, production schedules, inventory levels, and customer demand, providing a comprehensive view of the business landscape. Here’s how it works:
- Sales Forecasting Integration: Sales reps update forecasts, instantly integrating them into production planning for agile adjustments to market changes.
- Performance Metrics Visualization: Visualizes sales trends, forecast accuracy, inventory turnover rates, and production capacity utilization for clear insights.
- Cross-functional Collaboration: Enables sales, operations, and finance teams to align with organizational targets.
- Supply Chain Optimization: Helps manufacturers optimize schedules and inventory levels for efficient distribution and timely service delivery.
The Power BI S&OP Dashboard offers a visually appealing and intuitive interface that enhances the decision-making process. It empowers businesses to align their sales and operations strategies effectively, driving overall growth and profitability.
9. Measure your Labor Performance using Power BI
Labor and machines are the lifeline of the manufacturing industry. Efficient labor will contribute to manufacturing success in a significant way. Which is why there is a need for proper labour management. The Power BI manufacturing dashboard for Labor Performance offers valuable insights to optimize workforce productivity:
- Spot Trends: Monitor total hours worked, units produced per hour, and absenteeism trends to identify areas for improvement.
- Root Cause Analysis: Investigate productivity drops during specific shifts to address equipment downtime or training issues.
- Enhance Efficiency: Track labor utilization, productivity rates, and absenteeism to boost overall efficiency.
- Actual time Monitoring: Keep an eye on key performance indicators (KPIs) like labor utilization and absenteeism in real-time for immediate action.
With this dashboard managers can make data-driven decisions, improve workforce management, and enhance overall efficiency in manufacturing operations.
10. Overall Equipment Effectiveness (OEE)
The integration of an OEE system has proven to improve equipment efficiency, which ultimately increases production. Additionally, using OEE analytics can increase production by 25% over the same time in your manufacturing unit, yielding a larger return on investment.
Key Features of OEE Integration:
- Proactive Downtime Detection: Swiftly identify equipment downtime and make informed adjustments to production workflows.
- Diagnostic Recommendations: Utilize data-driven insights to enhance maintenance activities, boosting efficiency.
- Continuous Improvement: Promote ongoing enhancement, building resilience, and ensuring sustainable operations.
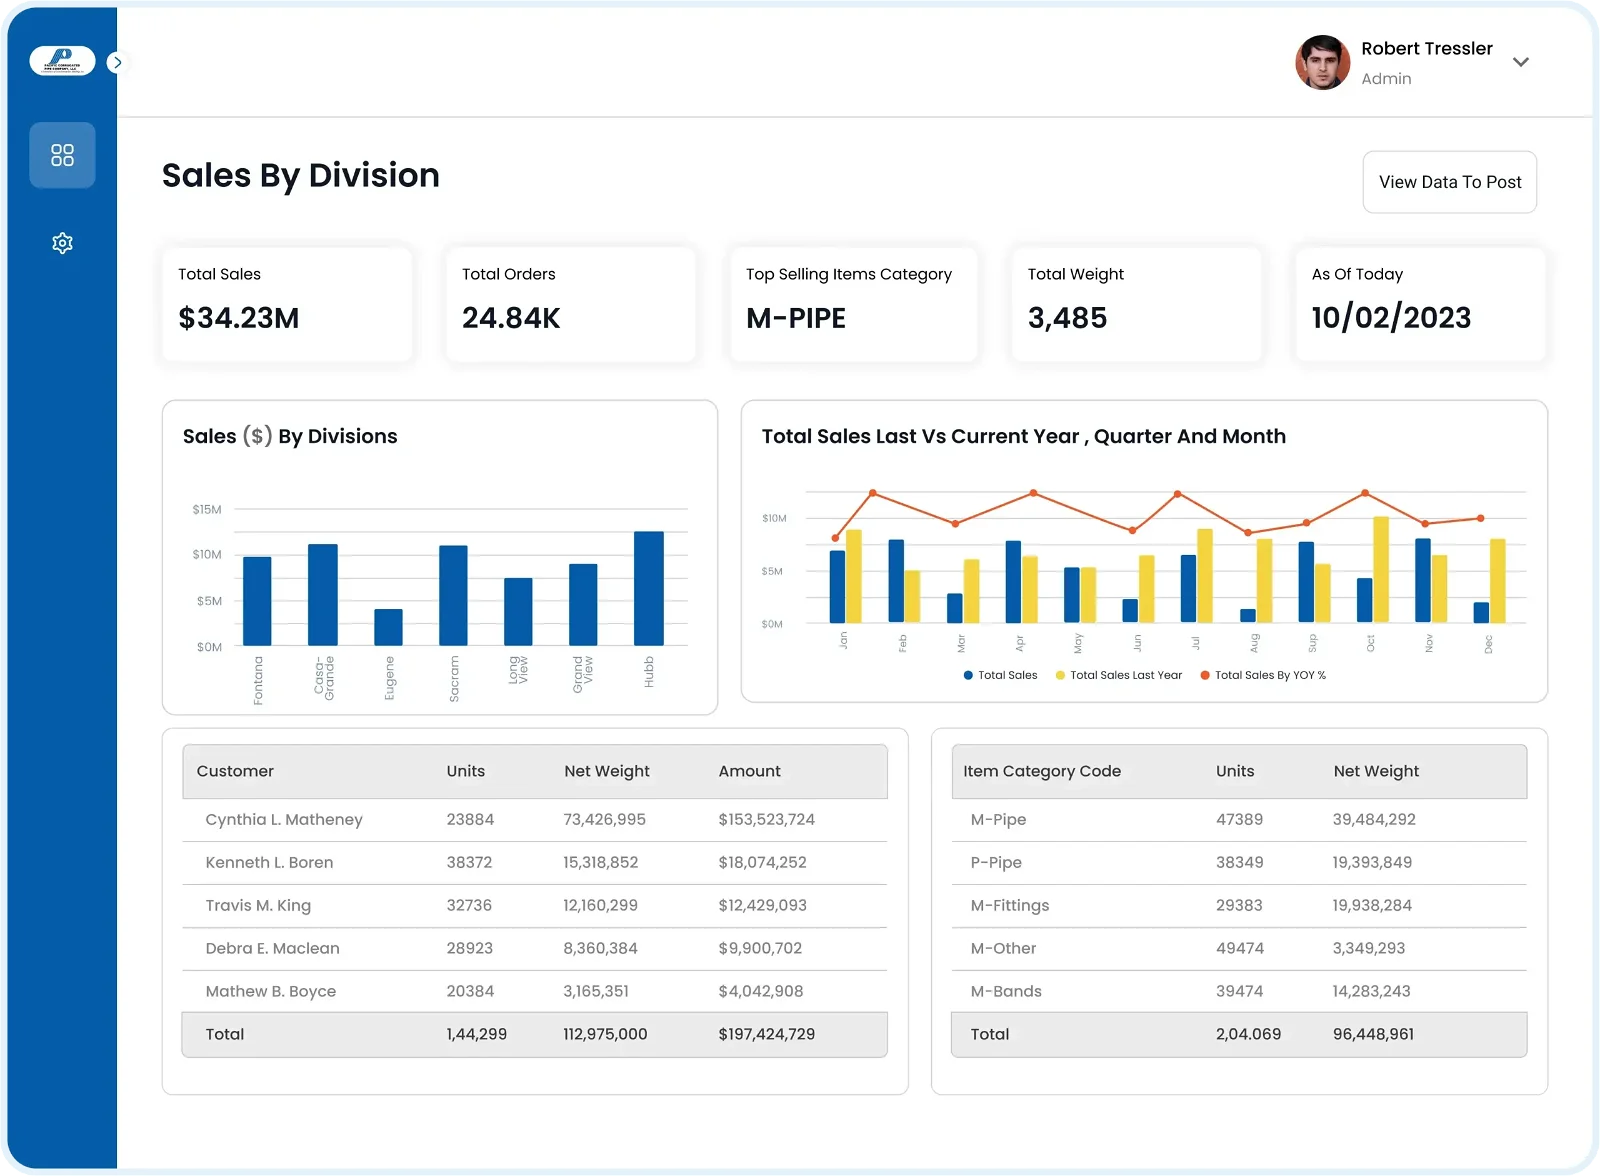
11. Power BI Finance Dashboard
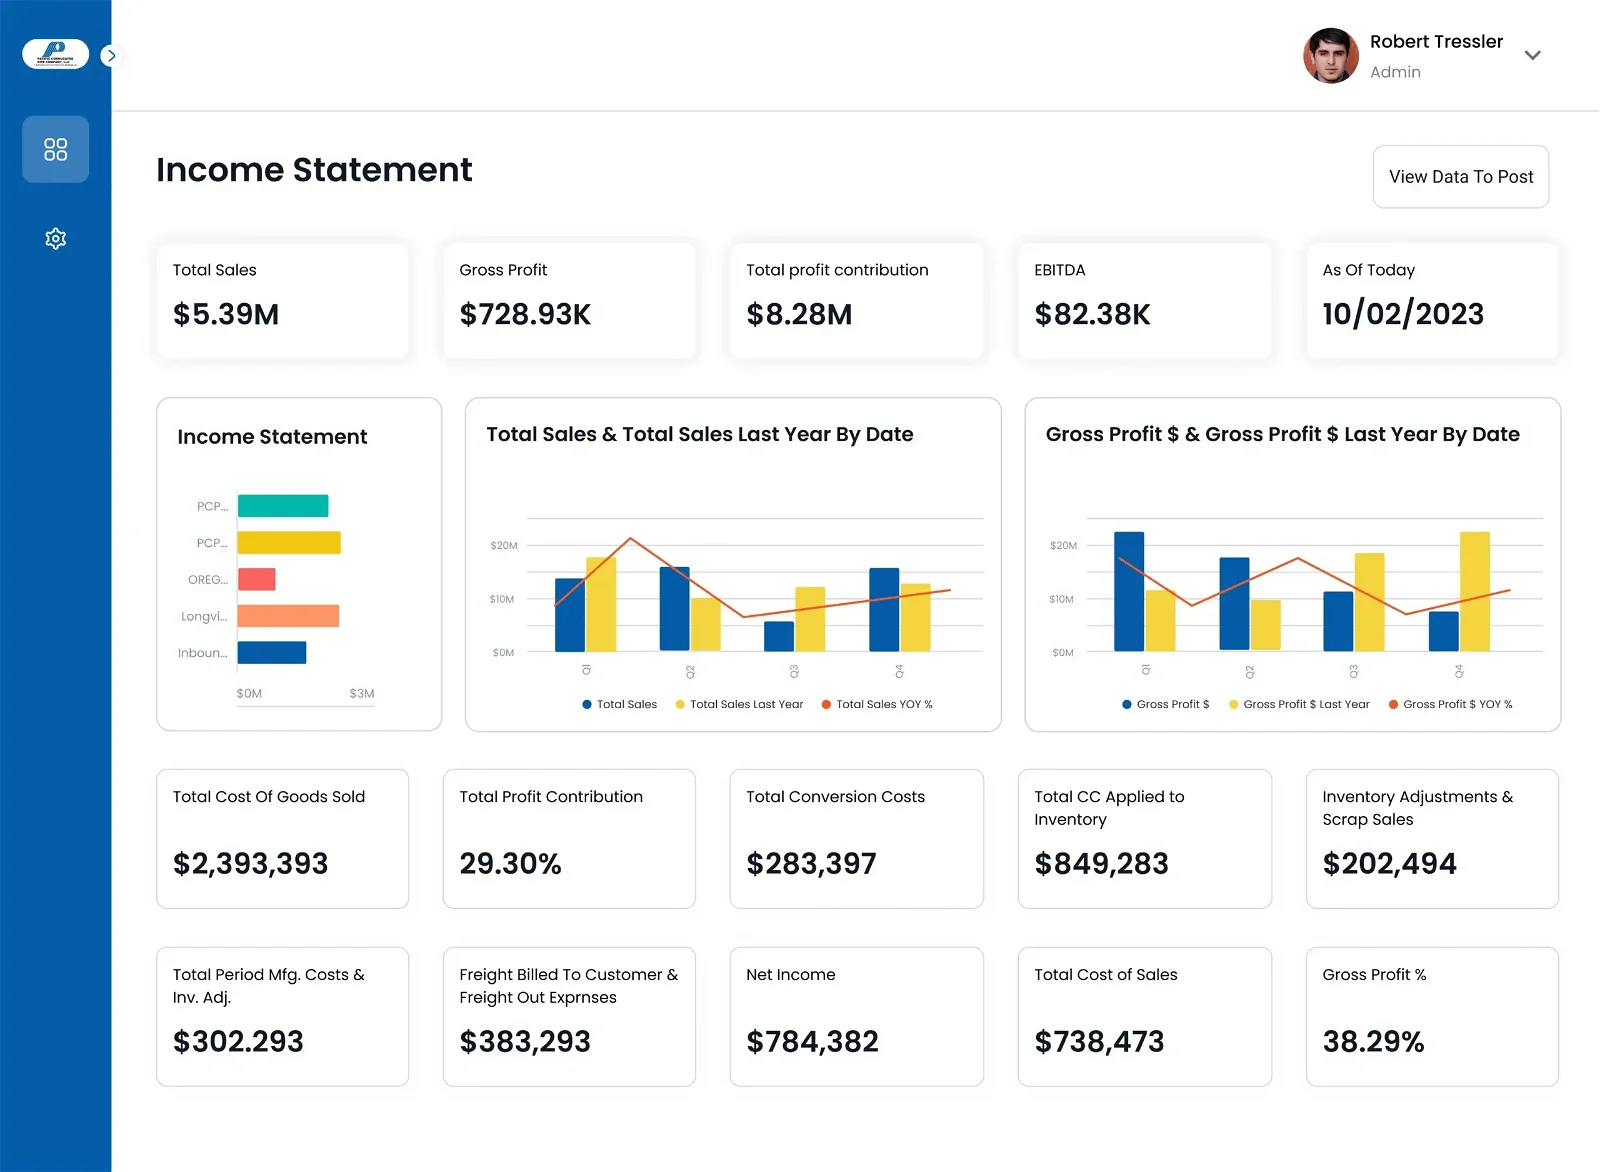
The Power BI Financial Dashboard is a powerful tool that provides a comprehensive overview of the financial health and production efficiency of a company. This dashboard changes how the company manages its finances and operations.
- Interactive Visualization: Engaging charts and graphs enable users to intuitively explore financial data, facilitating quick identification of trends and anomalies for informed actions.
- Key Metrics at a Glance: Essential financial KPIs, like revenue growth, profit margins, and liquidity ratios, are prominently displayed for swift assessment of overall financial health.
- Data Security: Assures that sensitive financial data is protected through robust security measures, such as encryption and access controls.
- Integration with Other Systems: Allows for seamless integration with other financial systems or data sources, enabling a more comprehensive view of financial information.
Pacific Corrugated Pipe Company, headquartered in California, faced challenges with manual tracking of departmental updates, especially in Sales and Finance, consuming significant time and resources with questionable accuracy. To address this, they adopted a Power BI reporting system, providing a centralized view of sales and finance data. This automated system streamlined report viewing and facilitated quick decision-making, ultimately enhancing financial management.
Conclusion
The implementation of Power BI dashboard integration in manufacturing companies is a great turn point for the companies to be data-centric and improve operational efficiency, quality, and competitiveness. The Power BI manufacturing dashboard provides an organization with actionable insights, predictive analytics, and smooth collaboration for smoother handling of the complications of modern manufacturing in real time and into the future.
As demonstrated by the many case studies, the transformational effects of the Power BI manufacturing dashboard are tangible, increasing productivity, reducing costs, and enhancing customer satisfaction. The adoption of this technology is the dawn of a new age of invention and prosperity for manufacturing around the globe.
Sunflower Lab has a partnership with Azure Databricks for Power BI development that will help you get the best Power BI development services. Contact us today to find the expert Power BI developers that will make your manufacturing operations soar to new heights.
Drive Success with Our Tech Expertise
Unlock the potential of your business with our range of tech solutions. From RPA to data analytics and AI/ML services, we offer tailored expertise to drive success. Explore innovation, optimize efficiency, and shape the future of your business. Connect with us today and take the first step towards transformative growth.
You might also like
Stay ahead in tech with Sunflower Lab’s curated blogs, sorted by technology type. From AI to Digital Products, explore cutting-edge developments in our insightful, categorized collection. Dive in and stay informed about the ever-evolving digital landscape with Sunflower Lab.