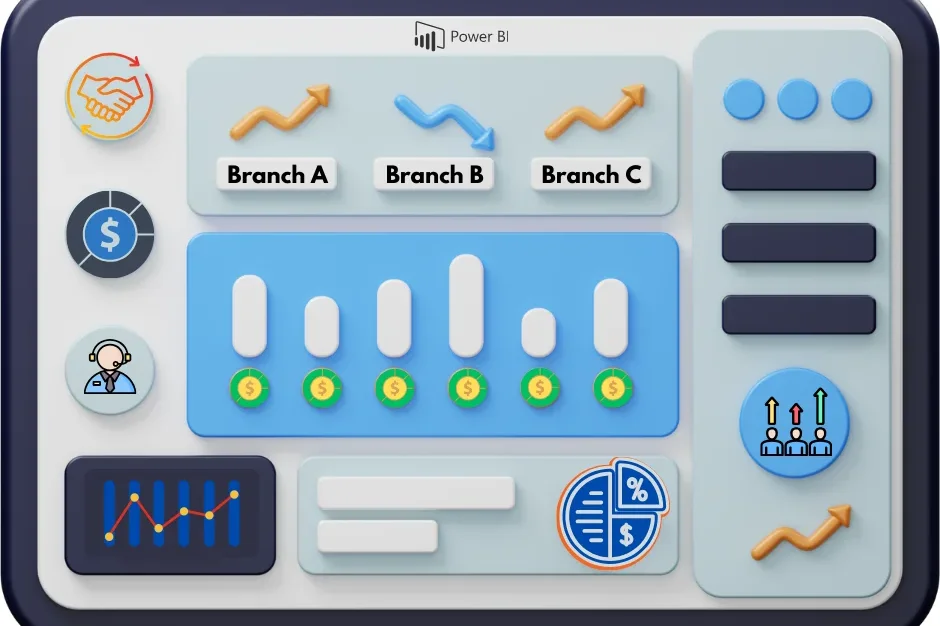
In the age of data-driven business operations, every decision is a substantial line of code in the software known as your company’s success. When it comes to inventory management, those lines of code translate into a dynamic representation of your stock, orders, and sales. Welcome to Power BI Inventory Dashboard, the powerhouse of business intelligence tools that can transform your inventory data into actionable insights.
From the complex interplay of stock levels to understanding customer purchase behavior, the Power BI Inventory Dashboard equips you to not only monitor but to predict and optimize your inventory strategies. Whether you’re a seasoned data analyst, an inventory manager with a thirst for analytics, or a Power BI enthusiast ready to maximize the true potential of your inventory data with the help of Power BI development services.
Benefits of Power BI Inventory Dashboard
Inventory management is a very powerful tool that offers unique and detailed insights into your organization’s inventory data. With the integration of Power BI, this tool becomes not just an observer but a strategic partner, providing real-time visibility into key metrics and enabling informed decision-making. Here are a few benefits of taking your inventory management to a whole new level with Power BI:
1. Improve Transparency and Visualize Key Performace Indicators
The Power BI Inventory Dashboard provides businesses with a 360-degree view of their inventory data, enabling them to track critical KPIs such as stock levels, turnover rates, and order fulfillment metrics. This enhanced transparency allows stakeholders to gain valuable insights into inventory trends and patterns, empowering them to make informed decisions to drive business growth.
2. Improved Inventory Control and Planning
With the Power BI Inventory Dashboard, businesses can take control of their inventory management processes by leveraging advanced forecasting tools, identifying slow-moving items, and optimizing stocking levels. This proactive approach to inventory planning leads to more efficient operations, reduced stockouts, and lower carrying costs.
3. Data-Driven Decision-Making for Competitive Advantage
The real-time data and analytics provided by the Inventory Dashboard enable businesses to make data-driven decisions that give them a competitive edge. By analyzing market trends, customer preferences, and supplier performance, businesses can adapt quickly to changing market conditions and stay ahead of the competition.
4. Cost Savings
Effective inventory management can result in significant cost savings by minimizing stockouts, reducing excess inventory, and optimizing ordering processes. The Inventory Dashboard helps businesses identify cost-saving opportunities by highlighting areas where inventory can be better managed and optimized, leading to improved profitability.
5. Boost Customer Satisfaction
By ensuring that the right products are available at the right time, businesses can improve customer satisfaction levels. The inventory management Power BI dashboard helps businesses monitor stock levels and track order fulfillment, allowing them to meet customer demands more efficiently.
6. Optimize Supply Chain
The Inventory Dashboard provides businesses with valuable insights into their supply chain performance, enabling them to identify bottlenecks, streamline processes, and improve overall efficiency. This leads to a more responsive and agile supply chain that can quickly adapt to changing market conditions and customer demands.
7. Streamlined Reporting Processes and Increased Operational Efficiency
The Power BI dashboard development services in inventory automate the reporting process, providing businesses with real-time insights and analytics that are essential for making informed decisions. This automation reduces the time and effort required to generate reports manually, freeing up resources to focus on more strategic tasks, ultimately leading to increased operational efficiency.
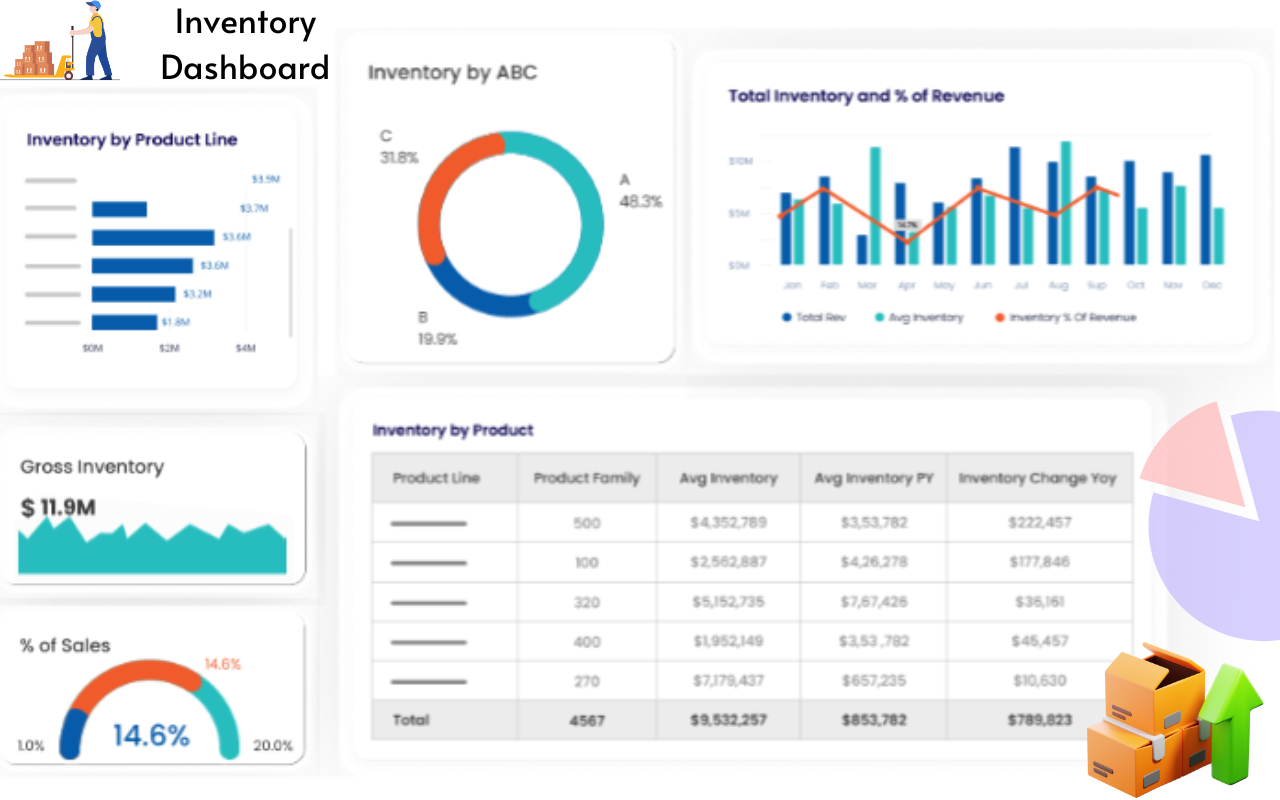
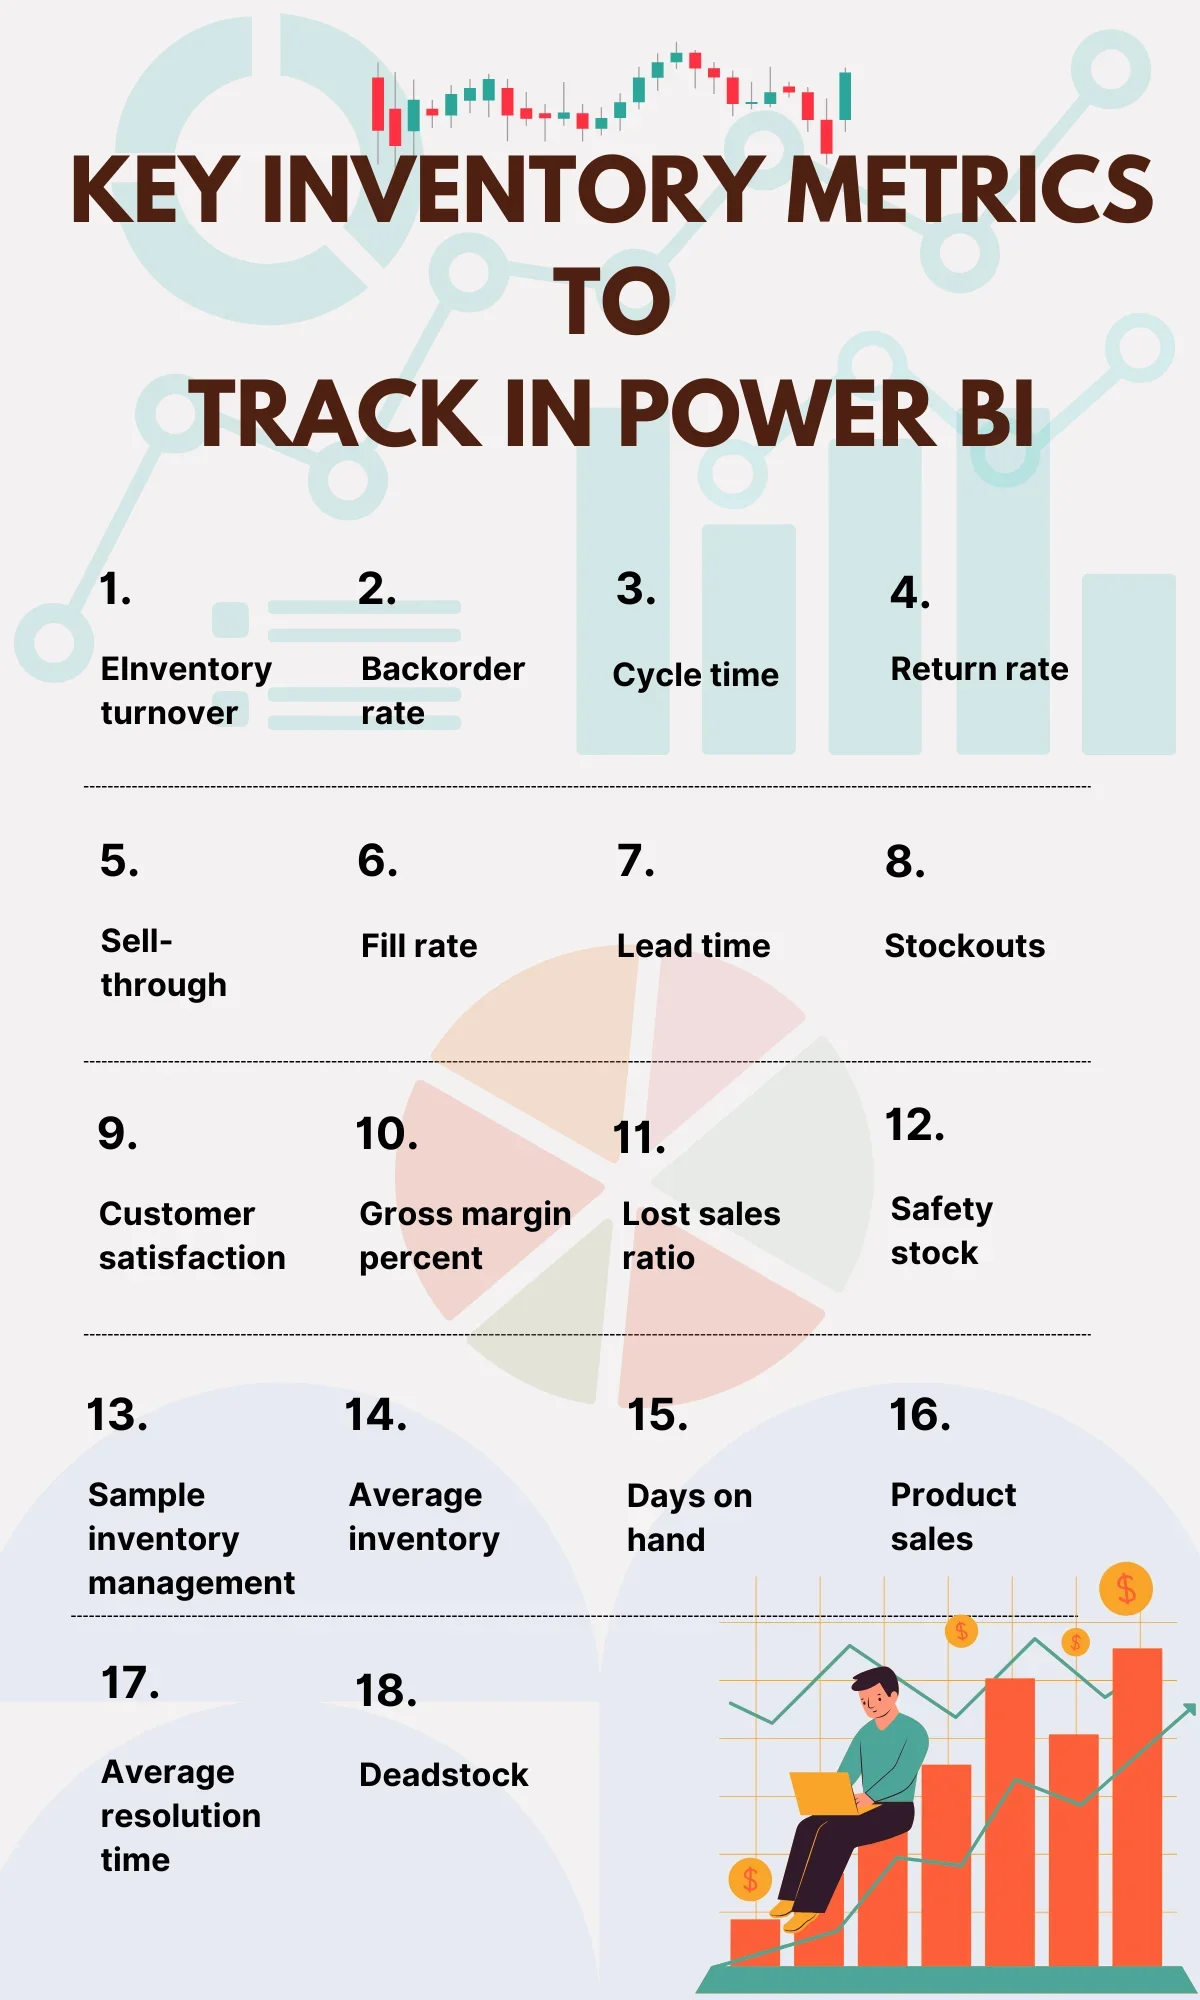
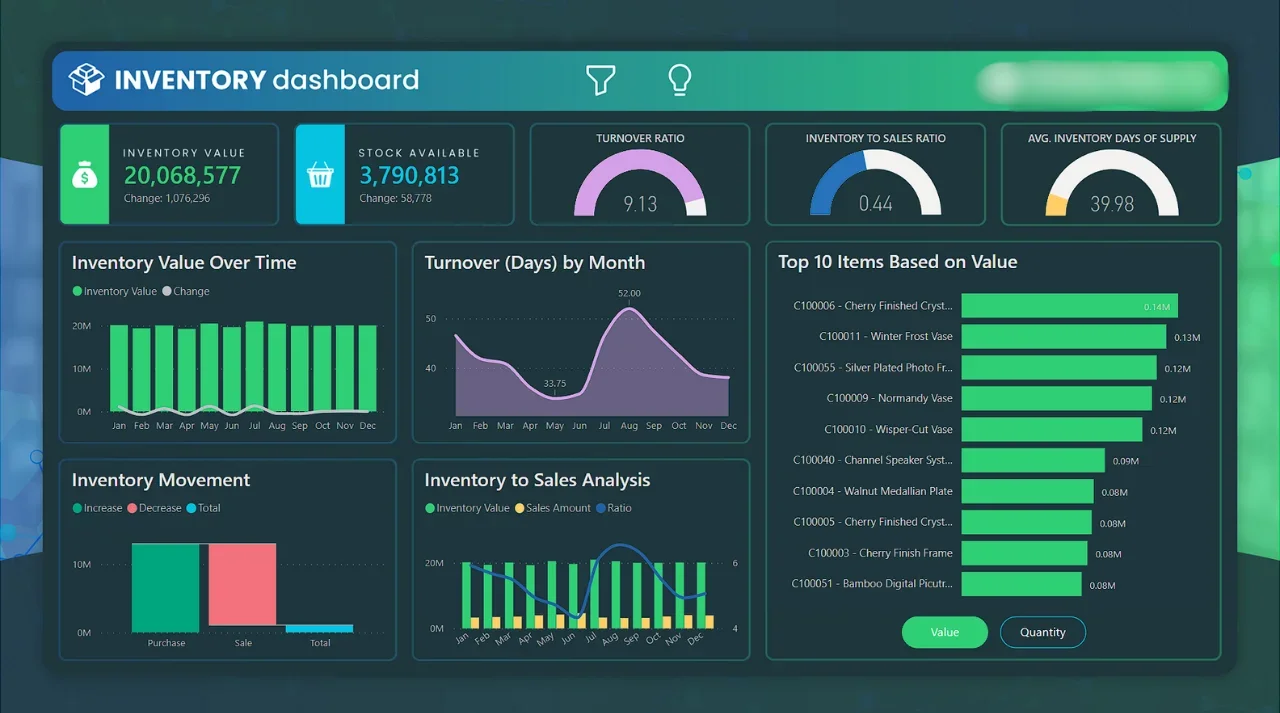
Key Inventory Metrics to Track in Power BI
The metrics that directly relate to your unique company goals and plans must be closely monitored and evaluated if you want to get the most out of your Inventory Power BI dashboard. Analyzing these important indicators will help you make educated choices to grow your company and obtain insightful knowledge about inventory value. Let us take a look at some of these critical indicators:
Power Up Your Business Intelligence with Power BI
Turn complexity into clarity with our user-friendly Power BI solutions.
Designing an Effective Data Model for Inventory Reporting in Power BI
- Structuring Your Data Model: Begin by identifying the key inventory data to include in your dashboard, such as product details, stock levels, sales history, and supplier information. Organize this data into separate tables, ensuring each table has a unique identifier (e.g., product ID or transaction ID) for easy data linkage.
- Creating Relationships Between Tables: Establish relationships between the tables in your data model using common fields. For example, link the product table to the sales table using the product ID field. This enables Power BI experts to combine data from multiple tables accurately and generate meaningful insights.
- Utilizing Power BI’s Modeling Capabilities: Leverage Power BI’s advanced modeling features, such as calculated columns and measures, to perform complex inventory analysis. For instance, create measures to calculate inventory turnover rates or monitor stock-out risks based on historical data. Use DAX (Data Analysis Expressions) formulas to create these calculated columns and measures for dynamic reporting.
Choosing the Right Visualizations and Charts for Inventory Reports in Power BI
Visualizations in Microsoft Power BI reports serve as introduction premises, which is essential for engaging viewers. They should achieve a balance between visual appeal and effective information delivery. When it comes to inventory reports, using the correct visuals is critical for presenting data in a clear and understandable manner. Here are some crucial guidelines to help you choose the most appropriate graphic components for your inventory reports.

- Bar Charts for Inventory Levels by Product: Bar charts are ideal for visualizing inventory levels by product, providing a clear comparison of stock levels across different products. This visualization in the inventory management dashboard is particularly useful for identifying products with high or low stock levels and making informed decisions regarding stock replenishment. For example, in healthcare, a hospital can use bar charts to track the availability of medical supplies like gloves, masks, and medications. By comparing current stock levels to desired quantities, the hospital can ensure it is adequately prepared for patient needs.
- Line Charts for Trend Analysis: Line charts are effective for analyzing trends in inventory levels over time. By plotting inventory levels over months or quarters, businesses can identify seasonal patterns, detect trends, and forecast future inventory requirements. For instance, in education, Power BI experts can create a dashboard for a university using line charts to track the usage of educational materials over a semester. By analyzing trends, the university can adjust its inventory of materials to meet the needs of students and faculty effectively.
- Pie charts for Inventory Distribution: Pie charts can be used to visually represent the distribution of inventory by product category or location. This visualization provides a clear overview of how inventory is distributed among different categories or locations, helping businesses identify areas where inventory may be overstocked or understocked. In the case of an e-commerce company, they can use a pie chart to display the distribution of products across different categories, like electronics, clothing, and home goods. This information can help the company make strategic decisions about product offerings and stocking levels.
- Heat Maps for Seasonality Analysis: Heat maps are valuable for analyzing seasonality patterns in inventory levels. By visualizing inventory data across different periods (e.g., months or quarters), businesses can identify peak seasons and plan their inventory management strategies accordingly. From a retail store point of view, they can use a heat map to visualize sales patterns throughout the year. By identifying peak seasons, the store can adjust its inventory to meet customer demand and maximize sales opportunities.
- Scatter Plots for Correlation Analysis: Scatter plots are useful for analyzing the relationship between inventory levels and other variables, such as sales data. By plotting inventory levels against sales data, businesses can identify correlations and patterns that can inform their inventory management decisions. For example, a manufacturing company can use a scatter plot to study the relationship between inventory levels and production output. By identifying correlations, the company can optimize its inventory management processes and improve operational efficiency.
Enhancing Decision-Making through Interactive Dashboards and Drill-Down Capabilities in Power BI
In inventory management, the ability to swiftly adapt to changing demands and market trends is paramount. Power BI’s interactive dashboards serve as a dynamic tool for real-time monitoring, offering a comprehensive view of inventory metrics and performance indicators.
Let’s think of a retail manager who can utilize Power BI dashboard development services to track inventory levels across multiple stores, monitor product sales in real-time, and identify fast-moving or slow-moving items. These interactive dashboards enable managers to make data-driven decisions on inventory restocking, pricing strategies, and promotional activities.
But the journey doesn’t end with surface-level insights. Power BI’s drill-down capabilities allow you to peel back the layers, analyzing specific product categories or even individual items over time. Imagine an inventory manager uncovering hidden trends in sales data, enabling them to optimize stock levels and improve overall efficiency. This granular view becomes your secret weapon for making strategic decisions based on concrete evidence, not just hunches.
Whether it is inventory management or any other field, there is no one-stop solution for all, and Power BI understands that. Customize your dashboard to perfectly align with your inventory needs. A manufacturing company, for instance, can track raw materials, production, and supply chain efficiency, gaining a crystal-clear perspective on their operations. This targeted approach simplifies decision-making and fuels performance improvement.
Utilizing Advanced Features and Functions in Power BI Dashboard in Inventory
Power BI development services offer a range of advanced features and functions that enable managers to conduct in-depth analyses and derive valuable insights. One such feature is the implementation of advanced DAX (Data Analysis Expressions) functions, which allow for complex calculations and analysis.
Power Query is another amazing Power BI feature that helps perform data cleaning and transformation. It can be implemented to clean and standardize inventory data from various sources, thereby eliminating possible data inconsistencies. This data can be useful to us for further studies like identifying inventory trends or forecasting future requirements.
Furthermore, users of Power BI dashboard development services may integrate unique visualizations and add-ons for specialized inventory insights. A pharmaceutical business, for example, can represent its inventory data more logically and informatively by using unique visualizations. These personalized graphics can reveal patterns in inventories, including which goods are in great demand and which vendors are operating profitably.
Leveraging Custom Calculations and Measures to Gain Deeper Insights into Your Inventory Data with Power BI
Power BI, with its robust features, allows you to do just that by leveraging custom calculations and measures. By creating custom calculations, you can manipulate your data to derive new metrics that suit your specific needs. By identifying key metrics like inventory turnover, days sales of inventory (DSI), and fill rate, you can use Power BI’s DAX language to craft precise calculations. These custom calculations enable you to generate comprehensive inventory reports that provide a holistic view of your inventory performance.
Implementing custom calculations and measures effectively requires a strategic approach. It’s essential to first identify the key metrics that align with your inventory management goals. Once identified, you can use Power BI’s DAX (Data Analysis Expressions) language to create these calculations. You can use DAX in multiple ways, like calculating the average days to sell inventory, tracking current stock levels, analyzing sales trends, or calculating the percentage of stockouts. Additionally, you can utilize conditional formatting in Power BI to visually highlight important inventory metrics.
AMOT, a manufacturer of industrial valves, relies on real-time inventory and backlog tracking to avoid operational issues. Like many manufacturing businesses, AMOT also dealt with vast amounts of raw data from various sources, including financial information like international bookings, revenue, inventory, backlog, and pipeline.
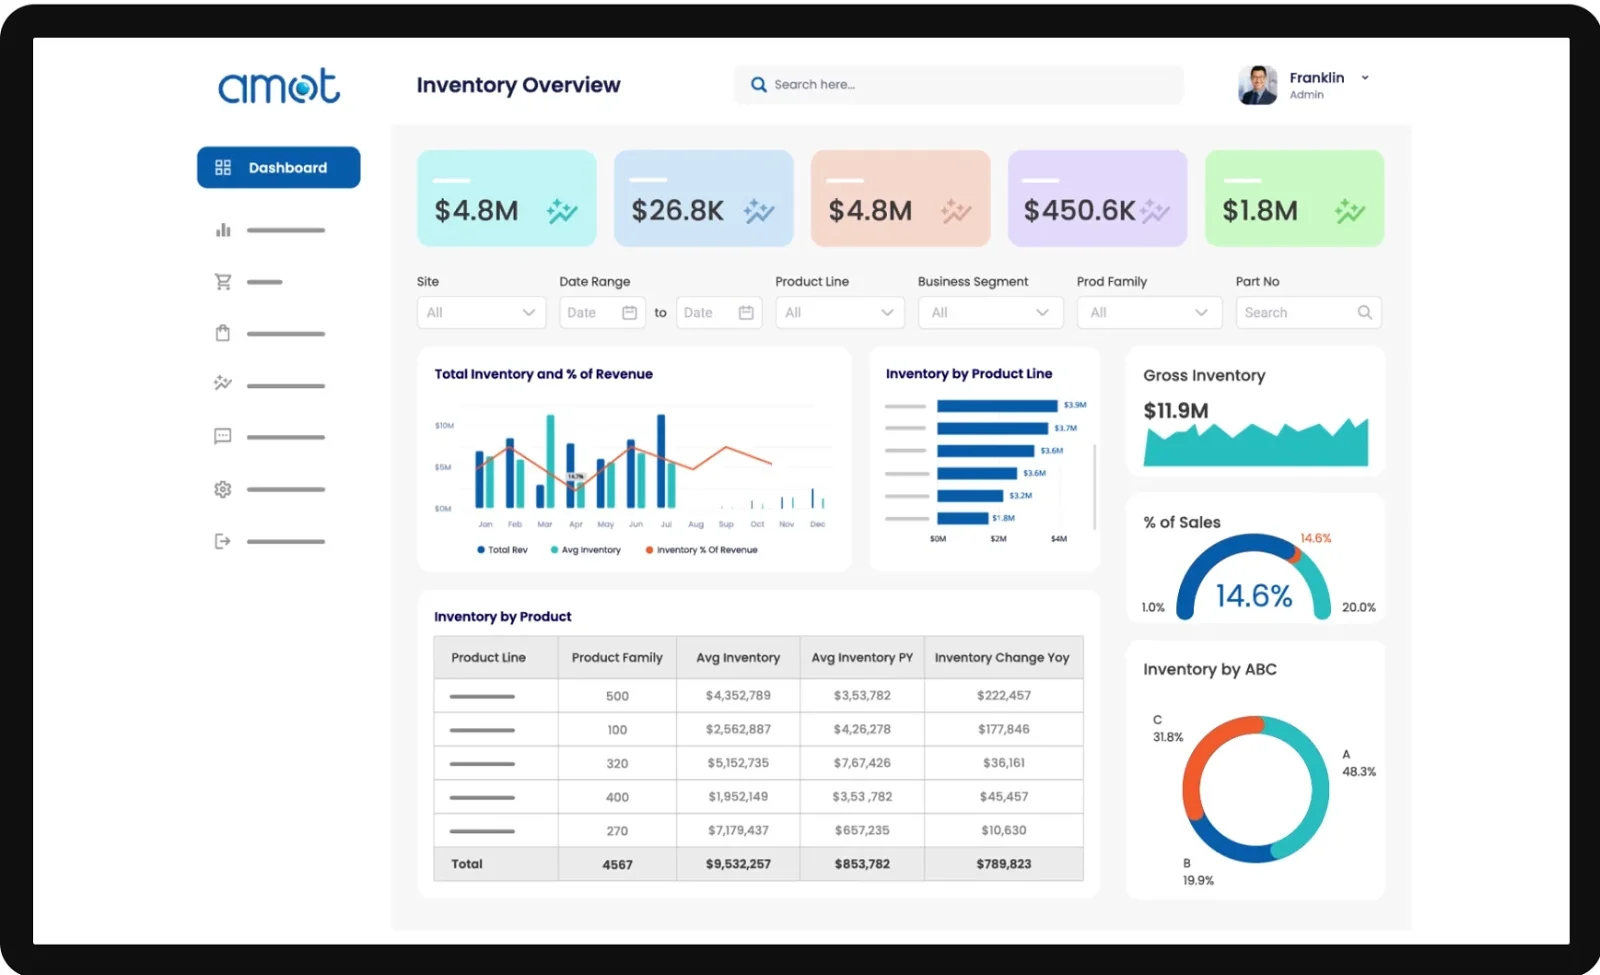
Sunflower Lab collaborated with AMOT to develop a Power BI dynamic dashboard solution empowered by DAX. DAX functions enabled complex calculations and data manipulations, allowing for dynamic queries and time intelligence. This real-time element added to the dashboards made them more up-to-date and valuable for AMOT’s inventory management decisions.
Analyzing Historical Sales Data to Optimize Stock Ordering Strategies with the Help of Inventory Power BI Dashboard
Just as studying the past illuminates the future, analyzing historical sales data holds the key to optimizing your stock ordering. Power BI empowers you to identify trends and patterns within customer purchasing behavior, informing your inventory management strategies.
Seasonal demand surges or customer preferences for bundled products – these valuable insights come to light through Power BI’s interactive dashboards and reports. By analyzing past data, you can forecast future demand more accurately, allowing you to order the right amount of stock at the right time. Additionally, historical sales data analysis can help you identify slow-moving or obsolete inventory, enabling you to take corrective action to reduce carrying costs.
Remember, the power lies in your hands. By analyzing historical sales data, businesses can optimize their stock ordering strategies, ensuring efficient inventory management practices.
Best Practices for Maintaining Accuracy and Consistency in Inventory Reporting with Power BI
A powerful Power BI dashboard is not just visually appealing but also highly functional, providing insights that drive informed decision-making. Maintaining accuracy and consistency in inventory reporting is crucial for any business, and leveraging Power BI Inventory Dashboards can greatly enhance this process. Here’s an industry-focused approach to these best practices:
- Define Clear Objectives: Clarity is power. Begin by articulating the specific objectives your inventory dashboard aims to achieve. Are you seeking real-time stock level snapshots, in-depth turnover analysis, or trend identification for demand forecasting? Defining these goals with precision ensures your dashboard is tailored to deliver the insights that matter most.
- Collaborate with Stakeholders to Meet their Needs: Remember, inventory data impacts various departments, from procurement to sales. Foster open communication and collaboration with key stakeholders across the organization. Understand their specific data needs and integrate them into your dashboard design. This collaborative approach ensures your dashboard resonates with diverse users and drives meaningful action across departments.
- Ensure Data Quality for Errors or inconsistencies: Garbage in, garbage out. This saying holds true for Power BI dashboards. Implement rigorous data quality checks to eliminate errors and inconsistencies. Validate data sources, establish data cleansing routines, and leverage Power BI’s built-in data quality tools. Remember, flawless data forms the foundation for trustworthy insights. So always involve regular data audits, automated data cleaning processes, and data governance policies to ensure data integrity.
- Empower Your Team by Providing User Training & Support: Even the best of the technology will be of no use if your workforce is not competent enough to use it. Provide comprehensive training to your team on how to use the Power BI Inventory Management dashboard effectively. This training should include not only how to navigate the dashboard but also how to interpret the data and use it to make informed decisions. Additionally, provide ongoing support to help your team address any challenges they may encounter.
- Evolve with Progress by Reviewing Power BI Implementation: As your business evolves, so too should your Power BI inventory dashboard. Regularly review and update your dashboard to reflect changes in your industry, such as new product lines, shifts in consumer demand, or changes in regulatory requirements. By staying agile and adapting your dashboard to meet the evolving needs of your business, you can ensure that it remains relevant and a valuable tool for inventory management.
A powerful Power BI dashboard is not just visually appealing but also highly functional, providing insights that drive informed decision-making. Maintaining accuracy and consistency in inventory reporting is crucial for any business, and leveraging Power BI Inventory Dashboards can greatly enhance this process. Here’s an industry-focused approach to these best practices:
Conclusion
The Power BI Inventory Dashboard is not just another business tool; it’s a strategic ally in your inventory management battle, a beacon that guides you through the data labyrinth. With its unparalleled abilities to ingest, visualize, and act on your inventory data, Power BI stands at the forefront of the data revolution, waiting for you to wield its power to transform your inventory handling into a fine-tuned symphony of logistics.
Empower your company to make informed decisions, take control of inventory management, and stand out in your industry with a personalized Power BI Inventory Dashboard. An investment in Power BI dashboard development is not just an investment in software; it’s an investment in the future of your business.
Explore the excellent Power BI development services provided by Sunflower Lab that can help you implement and optimize Power BI for your business. Contact our team of Power BI experts and unlock new opportunities for growth and success for your business.
Drive Success with Our Tech Expertise
Unlock the potential of your business with our range of tech solutions. From RPA to data analytics and AI/ML services, we offer tailored expertise to drive success. Explore innovation, optimize efficiency, and shape the future of your business. Connect with us today and take the first step towards transformative growth.
You might also like
Stay ahead in tech with Sunflower Lab’s curated blogs, sorted by technology type. From AI to Digital Products, explore cutting-edge developments in our insightful, categorized collection. Dive in and stay informed about the ever-evolving digital landscape with Sunflower Lab.