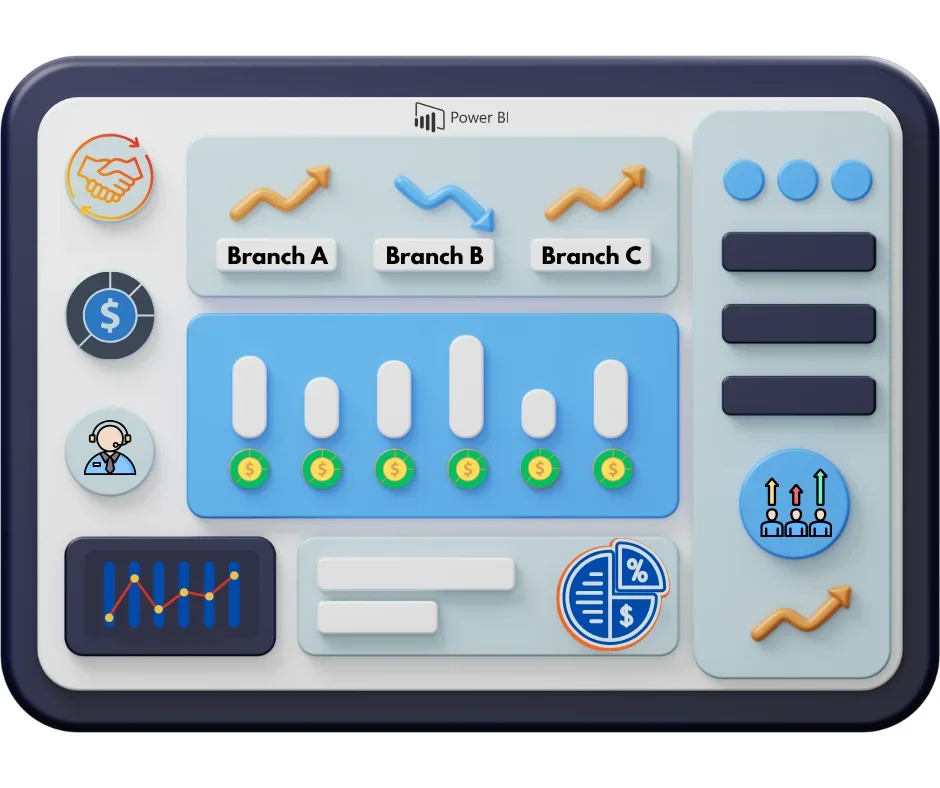
Driving Sales Efficiency and Insights With Power BI Sales Dashboard
In the highly competitive business landscape of today, success is not just about survival, but about thriving through strategic data utilization. At the forefront of this transformation is Power BI, Microsoft’s premier business analytics tool, empowering organizations with actionable insights and a competitive advantage.
Our Power BI development services cater to the evolving needs of modern sales teams, offering more than just data visualization – it provides a transformative experience that drives tangible business outcomes. Through top-tier customization, comprehensive analytics, and seamless integration, we empower businesses to elevate their sales strategies, enhance performance, and shape the future of their industry.
How is Power BI used in sales?
Power BI implementation transforms the sales process by establishing a data-driven foundation for strategic decision-making. Its extensive suite of analytics tools converts raw data into actionable insights at a glance view, allowing sales teams to customize their approach with exceptional precision. Key features like real-time data monitoring, predictive analytics, and interactive dashboards enable sales professionals to not just react to current market dynamics, but also forecast future trends and customer needs.
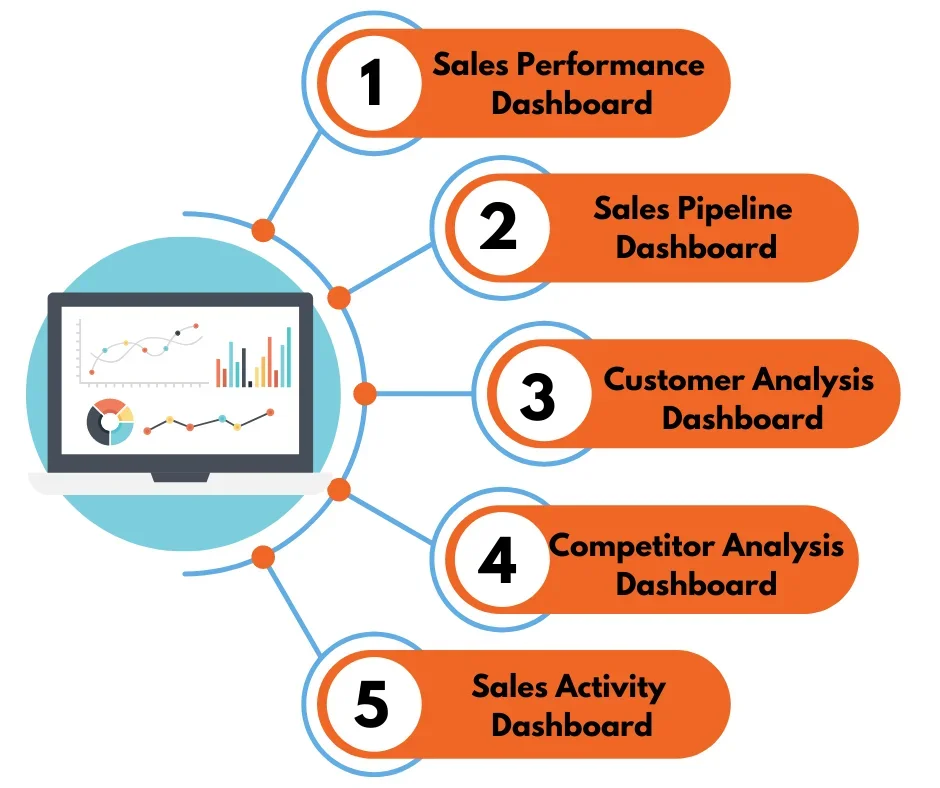
Types of Sales Dashboards
Sales departments excel with data-driven decisions and data analysis. Sales dashboards in Power BI offer a robust tool for business intelligence with custom visuals key metrics, spotting trends, and monitoring progress. Here are some typical types of Power BI dashboards used in sales and by sales managers to make better decisions.
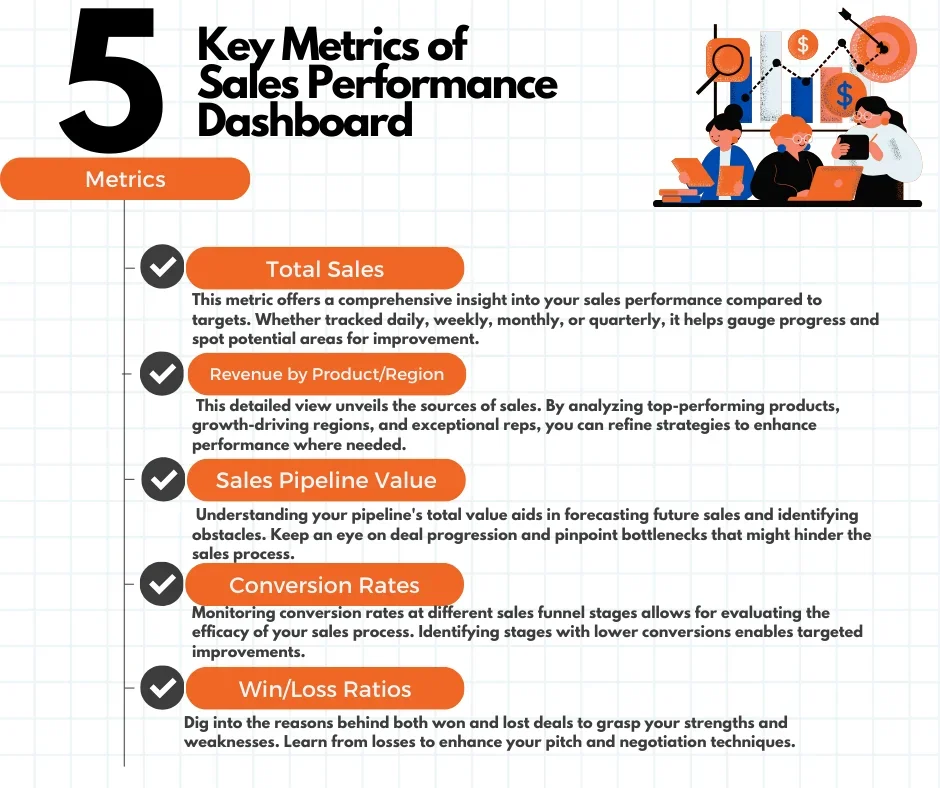
Sales Performance Dashboard
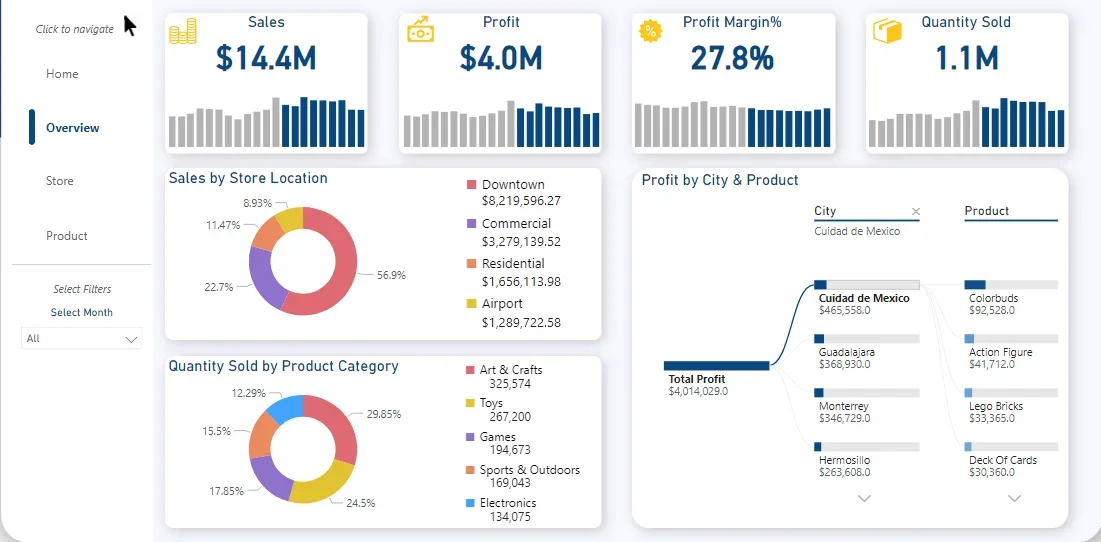
Visualize success and identify areas for growth with our precisely calibrated dashboard. Total sales, revenue breakdowns by product, region, and sales representative are not mere numbers but the narrative of your business. Monitor every heartbeat of your sales lifecycle, grasp your sales pipeline value, track conversion rates, and analyze win/loss ratios to strategize boldly.
The user (eg- sales manager) experience is dashboard’s top priority in design. This sales performance dashboard is engineered to enable users to filter data on-the-fly through intuitive slicers that span products, regions, and representatives. Use the custom date range filter to isolate specific timeframes or dissect win/loss outcomes for insights into every victory and setback.
Impact
- Real-time Insights: Instantly grasp your sales performance trends and patterns without getting lost in spreadsheets. Swift identification of trends facilitates prompt decision-making.
- Identify Top Performers: Acknowledge and incentivize top achievers among reps, products, and regions. Draw lessons from their success stories to replicate them company-wide.
- Spot Declining Trends: Proactively detect sales declines or dips in conversion rates or pipeline value before they escalate. Take corrective measures promptly to realign.
- Improve Forecasting Accuracy: Leverage data-driven insights for more precise sales forecasting. Optimize resource allocation and prevent unnecessary expenditures or staffing shortages.
- Data-Driven Decision Making: Base your sales strategies on concrete data source rather than intuition. Make well-informed decisions that elevate your overall sales performance.
Actionable & Valuable Insights
- Develop a targeted campaign for marketing teams to showcase the distinctive value proposition of your product in comparison to competitors. Highlighting the unique benefits and features that set your product apart can effectively attract customers seeking specific solutions tailored to their needs.
- Train your sales representatives extensively on strategies to not only counter competitor arguments but also to effectively communicate the unparalleled advantages of your product. Equipping your sales team with in-depth knowledge about your product’s strengths can help them build confidence and credibility in customer interactions.
- Analyze competitor offerings meticulously to pinpoint areas where your product or pricing strategy can be enhanced. Identifying gaps or weaknesses in competitor offerings can guide you in refining your own product features or pricing structures to better meet customer expectations and stand out in the market.
Success Story
The Sales Performance Power BI Dashboard serves as more than just a tool; it stands as a strategic ally that swiftly transforms data into tactical advantages. Acme Corp. recently linked a 25% increase in quarterly sales directly to dashboard’s real-time insights. By utilizing features like real-time analytics and predictive sales trends, their management team could promptly spot high-potential leads, leading to a more targeted sales approach and a significant boost in the conversion rate.
Sales Pipeline Dashboard
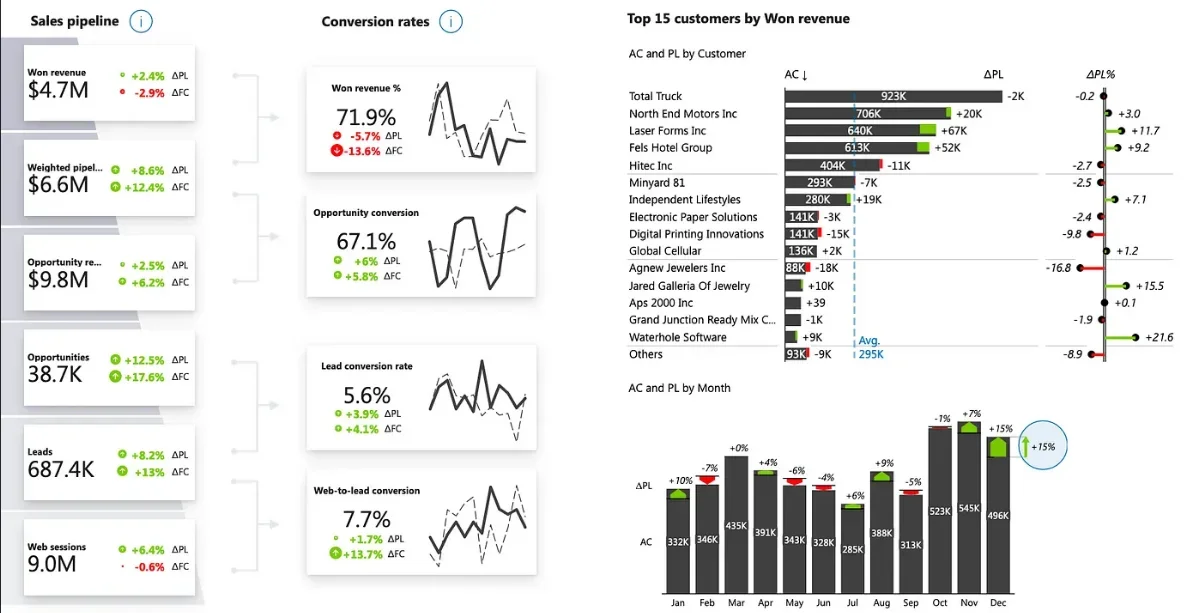
The Sales Pipeline Dashboard transcends being a mere data display; it serves as your keen insight into the complexities of your sales processes. It enables you to precisely identify potential issues within the pipeline. Discover the reasons behind stalled deals versus those that surge ahead, empowering strategic resource allocation to optimize your sales pipeline flow and advance every opportunity towards closure.
Hire Power BI developer and get best Power BI sales dashboard which provides you with the expertise to navigate through a plethora of opportunities and pinpoint those valuable chances with the highest conversion rates. Prioritize efficiently; concentrate where it matters most, and witness your team’s productivity reaching new heights.
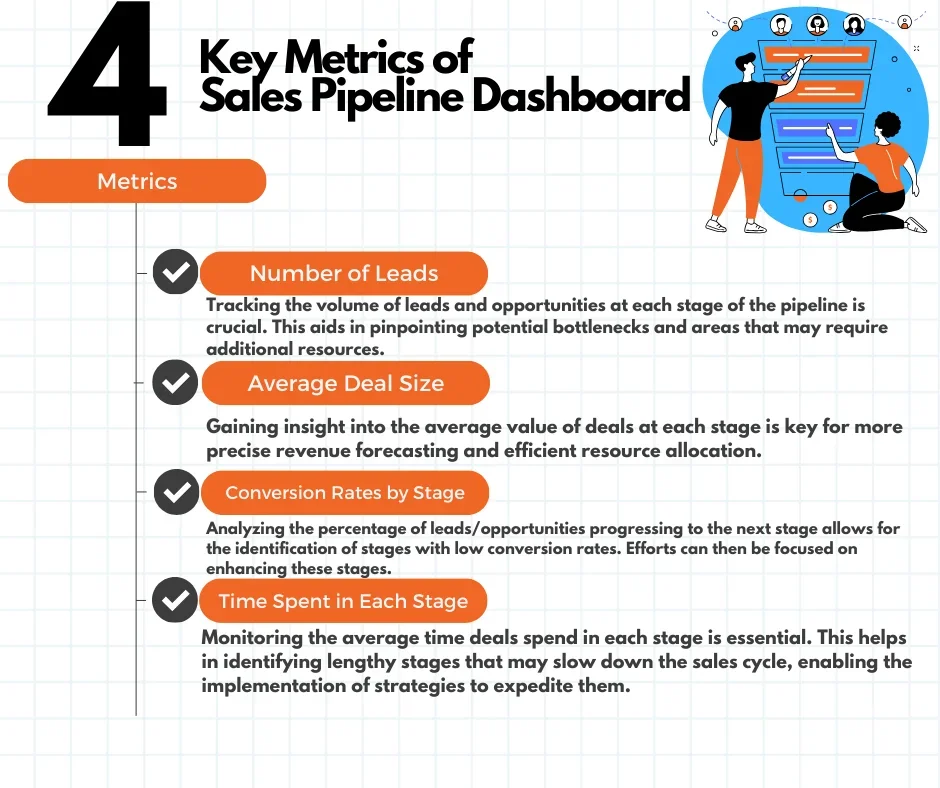
Impact
- Identification of Bottlenecks: By precisely pinpointing the specific stages within the sales process where deals tend to stall or slow down, you can effectively diagnose underlying issues such as sluggish qualification procedures, ineffective sales presentation techniques, or insufficient follow-up mechanisms.
- Lead Prioritization for Maximum Returns: Strategically allocating resources towards high-potential opportunities with exceptional conversion rates can significantly enhance the efficiency of the sales cycle, ensuring a more focused and productive approach.
- Streamlining Sales Process for Optimal Performance: Identifying key areas for improvement and implementing targeted changes to streamline the sales process can result in quicker deal closures, improved operational efficiency, and ultimately, increased revenue generation.
Actionable & Valuable Insights
- Optimize qualification criteria: Ensure they are clear, concise, and aligned with your ideal customer profile. Train sales reps to efficiently qualify leads and avoid wasting time on unqualified prospects.
- Establish a lead scoring system: Prioritize leads based on their potential value and fit with your ideal customer profile.
- Set up a follow-up process: Define clear steps and timelines for following up with qualified leads to keep them engaged and move them through the pipeline faster.
- Review lost deals: Identify reasons why deals are not progressing from qualification and address them through enhanced sales presentations, targeted incentives, or addressing specific pain points.
Success Story
In a recent case study conducted by TechTimes Analytics, an enterprise-level telecommunications company successfully used Power BI consulting to develop sales pipeline dashboard to enhance their sales operations significantly. Through the detailed analytics available on the Power BI dashboard, they achieved an impressive 35% increase in lead conversion rate within just two quarters.
Into a Data-Driven Tommorow
Empower Your Business by Tapping into Smart Data through Power BI
Why is Sales Forecasting & Trend Analysis Important for You?
Sales forecasting with Power BI helps businesses accurately predict future sales trends. It enables sales teams to spot opportunities and risks, optimizing sales strategies effectively. This process is crucial for estimating future sales and revenues, essential for planning and resource allocation.
Trend analysis provides insights for informed decisions based on historical data. By examining financial and operational trends, organizations gain a better understanding of their performance over time. Additionally, trend analysis aids in recognizing market trends and understanding competitors’ strategies, improving sales forecasting accuracy.
Customer Analysis Dashboard
The Power BI dashboard offers a comprehensive 360-degree perspective on your customer demographics, analyzing key variables like age, location, and income. This detailed insight forms the basis for a strong marketing strategy that connects with your audience, ensuring every campaign hits the mark.
With the Purchase History and Spending Patterns metrics, Power BI dashboards provides you with the insights to strategically time your upsells and cross-sells. Through analyzing past purchasing behaviors, customer analysis dashboard assists in identifying optimal moments to introduce customers to new products that capture their interest, effectively boosting average order value and customer lifetime value.
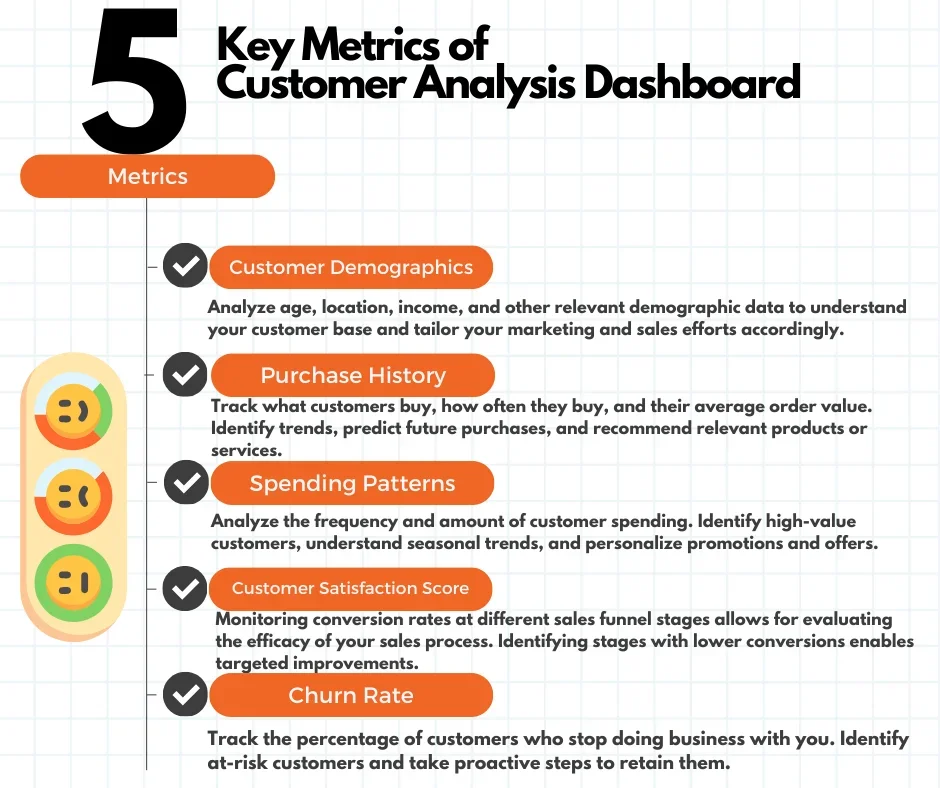
Impact
- Personalized Approach: Utilize customer insights gathered from various touchpoints to customize your communication and offerings according to individual preferences, fostering a sense of connection and relevance. This tailored approach not only boosts engagement but also drives sales by resonating with each customer on a personal level.
- Upselling/Cross-selling Opportunities: Leverage customer data, including past purchases and spending behavior, to identify upselling and cross-selling opportunities. By recommending complementary products or services based on their history, you can enhance the customer experience and maximize the revenue generated from each customer interaction.
- Churn Prevention: Proactively detect customers showing signs of potential churn by analyzing their behavior and engagement metrics. Implement targeted retention strategies such as personalized discounts, exclusive offers, or loyalty programs to incentivize them to stay loyal to your brand and reduce churn rates effectively.
- Improved Customer Relationships: Showcase your attentiveness to individual customer needs and preferences by tailoring your interactions and solutions accordingly. By demonstrating a deep understanding of their unique requirements, you can build stronger trust and foster lasting loyalty, leading to a more robust and enduring customer relationship.
Actionable & Valuable Insights
- Personalize your outreach through email: Reference their previous purchases, showcase new products in their favorite categories, and provide a discount to encourage engagement.
- Seek feedback: Inquire about recent inactivity and satisfaction levels to address any concerns or unmet needs effectively.
- Monitor interactions: Keep track of their responses to your communications and adjust your strategy based on their feedback and actions.
Success Story
Numerous prominent industry leaders have leveraged the powerful capabilities of Power BI customer analysis dashboards to propel significant business achievements. Successful Power BI dashboard examples include Contoso Ltd, a global retail powerhouse, harnessed Power BI development to fine-tune their customer satisfaction strategy. By incorporating real-time analytics, they witnessed a 25% surge in customer retention rates in the initial quarter following implementation (Source: Contoso’s Annual Business Report)
Competitor Analysis Dashboard
With Power BI dashboard, your sales pitches gain added persuasion, your pricing strategies become more precise, and your marketing campaigns are finely targeted. Equip yourself with insights into competitor pricing and tailor your offerings to showcase value that resonates with savvy customers, ensuring that each price point you establish is a strategic stroke of brilliance.
Utilize comprehensive comparisons of product features against those of competitors to highlight your strengths prominently and tackle any weaknesses directly. Build trust with your customer base by showcasing how your products not only meet industry standards but surpass them with impactful innovative features.
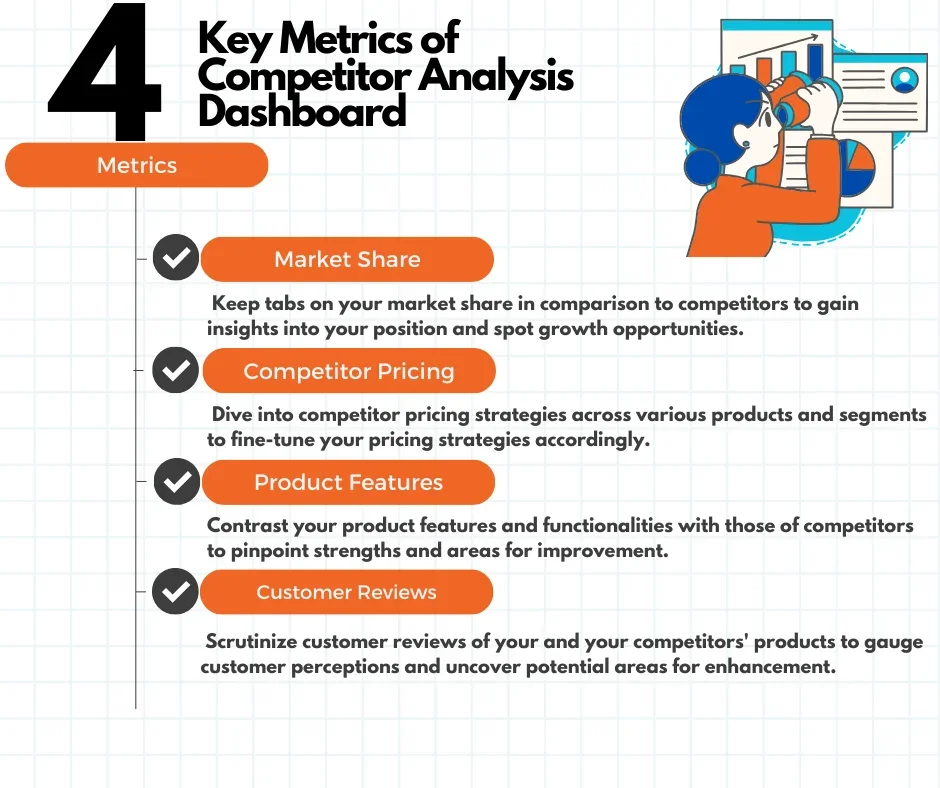
Impact
- Elevated Sales Pitch: Empower your sales team with a comprehensive insight into competitor offerings and weaknesses, enabling them to strategically position your product, differentiate from the competition, and proactively address customer queries and objections.
- Insightful Pricing Strategies: Utilize thorough competitor analysis to inform pricing strategies, ensuring that your pricing decisions not only sustain competitiveness in the market but also optimize profitability by understanding market dynamics and customer perceptions.
- Tailored Marketing Campaigns: Craft personalized marketing campaigns that not only highlight your product’s unique selling propositions but also directly address specific pain points of customers identified through in-depth competitor analysis, enhancing customer engagement and brand loyalty.
Actionable & Valuable Insights
Highlight your unique value proposition by focusing on the key attribute that distinguishes your product from competitors and explain how it addresses the specific needs and desires of your target audience. This differentiation is crucial in capturing the attention and loyalty of your customers.
Real Time Success
Zylker Enterprises, a medium-sized tech firm, experienced a notable 20% boost in market share within six months of implementing our Power BI Competition Analysis Dashboard. By utilizing Power BI’s dynamic competitor pricing data, Zylker swiftly adjusted their pricing model in response to competitive changes during key industry events and seasonal sales peaks. This strategic move positioned Zylker as the top value provider in its category.
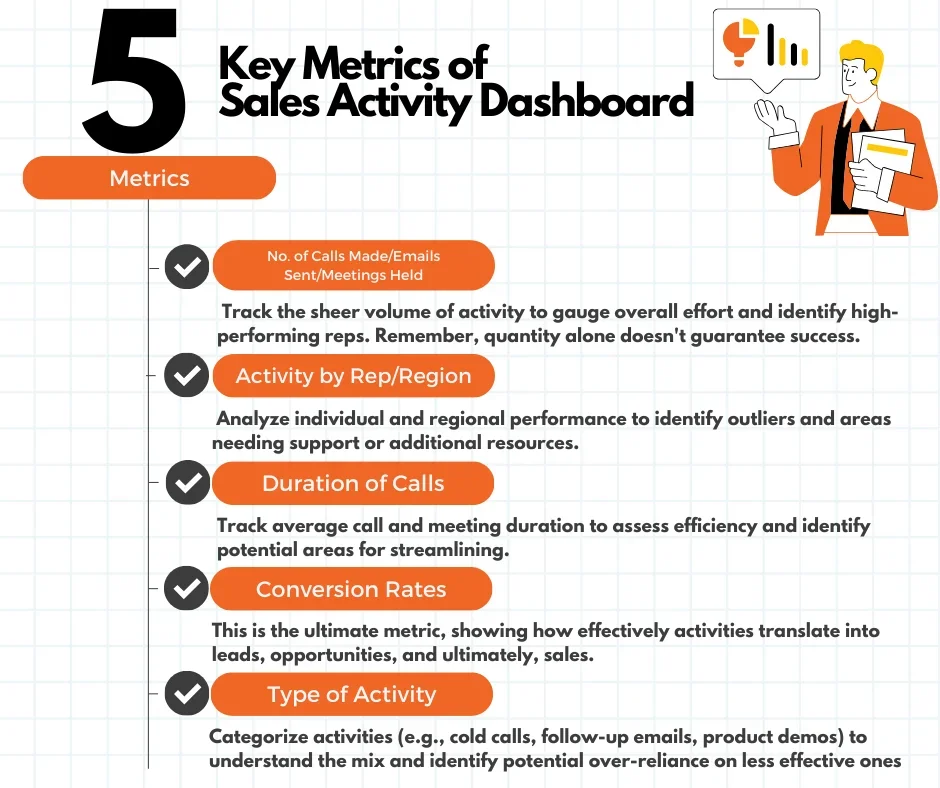
Sales Activity Dashboard
Considering the number of calls made, emails sent, and meetings held, Power BI report act as the visual representation of your sales teams’ efforts. By monitoring activity volume from data sources, you can pinpoint the most dedicated performers and establish valuable insights for evaluating team workload.
Conversion rates act as the vital link between actions and outcomes. While a high call volume is promising, its true value lies in driving sales. With sales dashboard, get these metrics to gain a comprehensive understanding of your sales funnel, ensuring that each endeavor propels you closer to sealing the deal.
Impact
- Optimize Activity Mix: Ensure the team focuses on high-value activities with proven conversion rates, maximizing their impact.
- Data-driven Coaching: Use data to provide personalized feedback to reps, highlighting strengths and areas for improvement based on their specific activity patterns.
- Track Progress and Measure Success: Monitor individual and team performance over time to measure the effectiveness of coaching and training efforts.
- Align Activity with Goals: Ensure sales activities are aligned with specific goals and objectives, maximizing their contribution to overall sales success.
Actionable & Valuable Insights
- Review call recordings: Listen to recorded calls to pinpoint specific areas where the sales representative’s call approach and communication skills can be improved. Look for opportunities to enhance their customer interactions and overall performance.
- Offer targeted coaching: Provide personalized coaching sessions that focus on refining the rep’s cold calling techniques and streamlining the process of lead qualification. Tailor the coaching to address individual strengths and areas for improvement.
- Propose alternative strategies: Explore the potential benefits of incorporating personalized email strategies or leveraging social media engagement to enhance the sales representative’s outreach efforts. Evaluate which approaches could yield better results and support the rep in implementing these strategies effectively.
- Track progress: Continuously monitor the rep’s performance following coaching sessions to assess the impact of the strategies implemented. Make data-driven adjustments as needed to optimize the rep’s sales effectiveness and success.
Real Time Success
A financial services company experienced a notable transformation in sales operations with the implementation of a Power BI sales dashboard. They encountered hurdles like ineffective lead tracking, inconsistent sales, and a lack of real-time insights. Through Power BI solutions, they streamlined sales data to monitor activities, evaluate performance, and identify trends instantly. This resulted in a 30% surge in quarterly sales and a 20% rise in lead conversion rates due to enhanced visibility and insights. Representatives could easily monitor progress, enhancing customer interactions. (Source: Power BI Users Group Summit, Case Study on Financial Services Company’s Sales Transformation with Power BI)
Why Do You need to Automate your Sales Reporting?
Understanding the vital role data plays in guiding informed decisions is crucial. Nonetheless, conventional reporting methods can prove time-consuming, error-prone, and deficient in essential real-time insights.
- Seamless CRM Integration: Power BI effortlessly integrates with top CRM systems such as Salesforce and Microsoft Dynamics. This removes the need for manual data entry and ensures reliable, current information for your reports.
- Automated Report Generation: Bid farewell to endless spreadsheets and laborious data analysis. Power BI automates report generation, freeing you from manual tasks and enabling you to focus on strategic decision-making.
- Real-time Insights: Power BI converts static data into dynamic dashboards that offer real-time insights. Monitor key performance indicators (KPIs) like sales pipeline, conversion rates, and individual performance – all in an interactive, user-friendly format.
What are the sales metrics in Power BI?
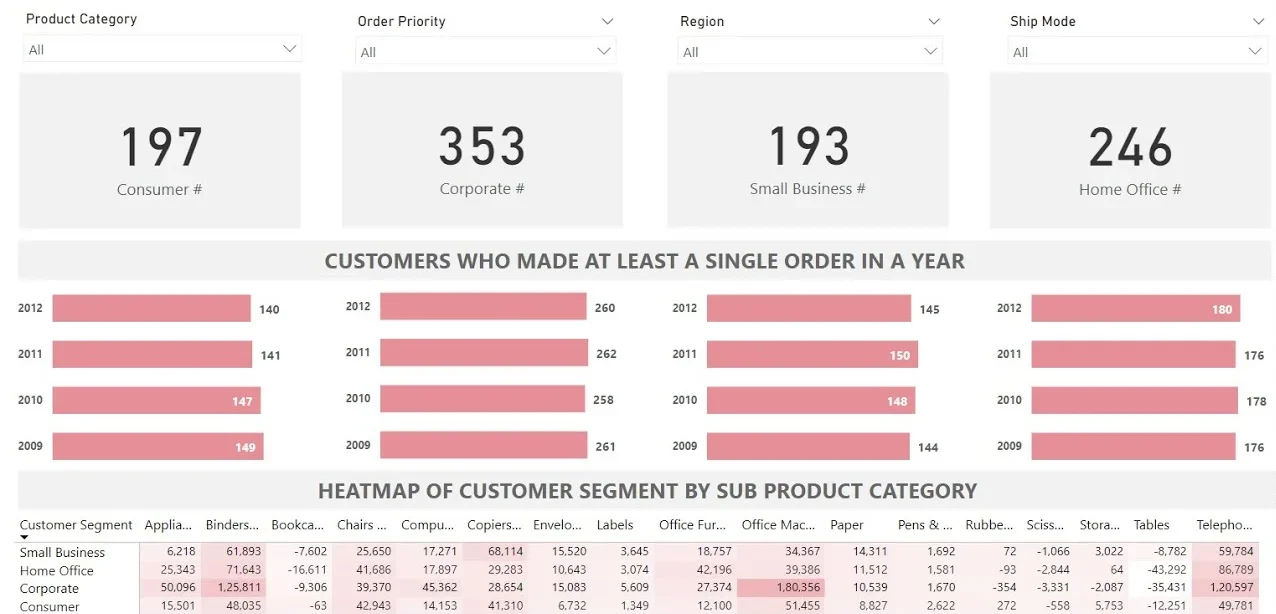
The Power BI dashboard offer comprehensive visualizations of sales data to monitor and analyze sales performance effectively. These dashboards display key sales metrics such as total sales, profits, sales prices, average order value, and additional performance indicators graphically within the detailed sales report, bar chart, line charts, product category, pie chart providing valuable insights for strategic decision-making and sales optimization.
Real Time Impact
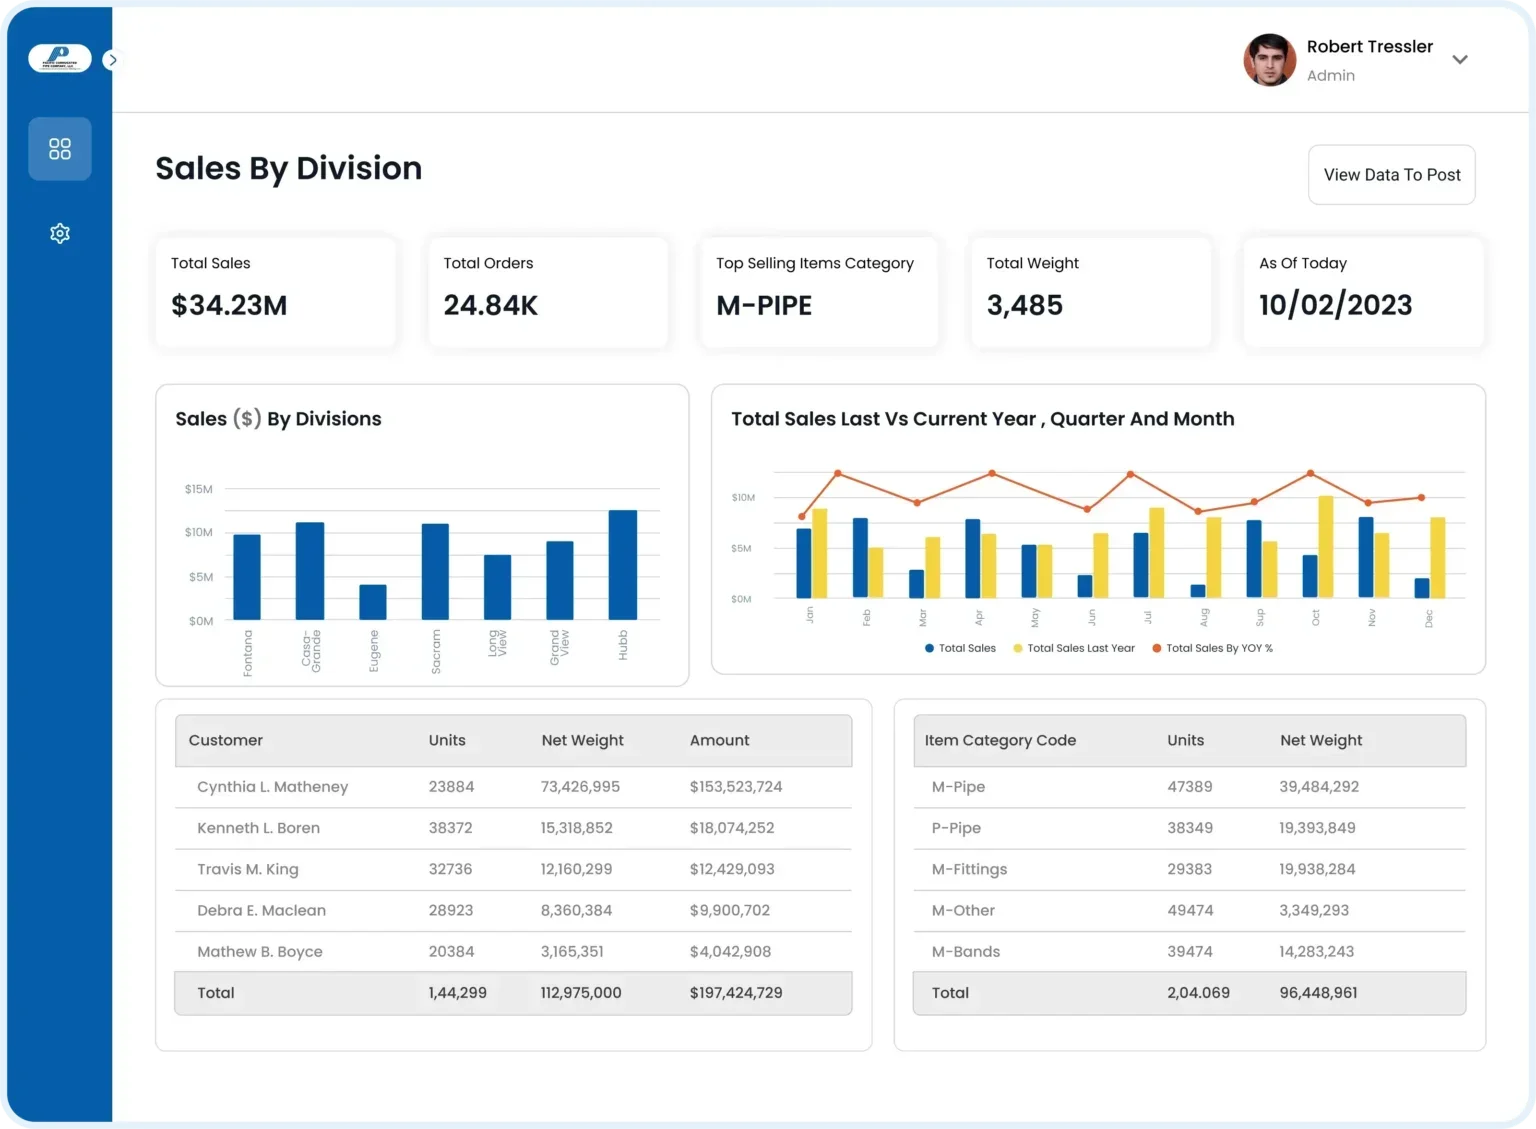
- Company: Pacific Corrugated Pipe Company, is a specialist in producing both ready-made and custom pipes tailored to market demand.
- Challenges: The company encountered difficulties in tracking and visualizing sales and financial performance data, managing demand-supply chains, and aligning with their KPIs.
- Solution: Pacific Corrugated Pipe Company sought out Sunflower Lab for start building an integrated solution utilizing Power BI reporting, Synapse Analytics, and Azure Data Lake to automate and streamline their data analytics and decision-making processes.
- Benefits: The company gained valuable insights into plant and organizational performance, reports, sales of product groups and item categories, profit/loss analysis, and other key performance indicators. This empowered them to strategize effectively and enhance overall growth.
Read the detailed case study of strategy making by PCP with the help of Sunflower Lab and Power BI Here. Also, here are some of the best Power BI dashboard examples:
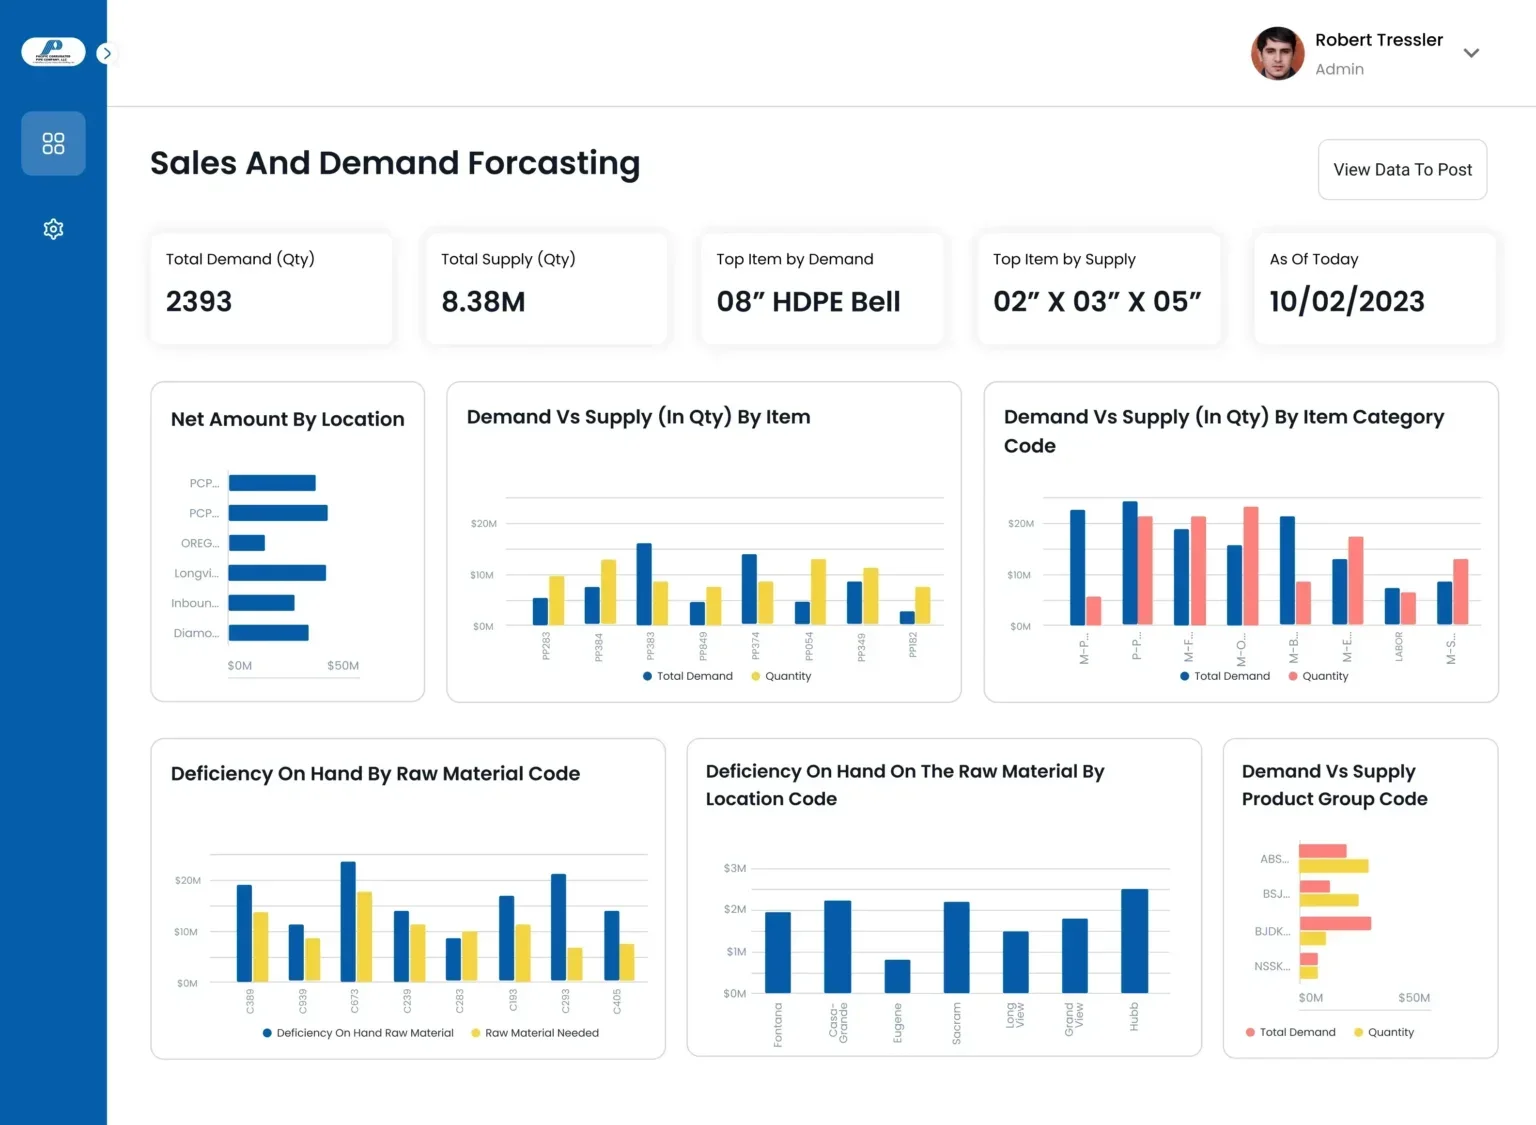
Another Power BI dashboard examples include sales and demand forecasting dashboard:
Conclusion
With Power BI dashboard development services, you unlock the potential to not only visualize key sales metrics but to revolutionize the way data drives decision-making. As data analysts, sales managers, and business intelligence professionals, we aim for excellence.
Capitalize on the future of market analytics. Partner with us to explore the capabilities of the Power BI Sales Dashboard. Reach out to our Power BI Experts to discuss tailoring a competitive analysis solution to meet your business needs. It’s time to outsmart the competition. Contact Us Today
Drive Success with Our Tech Expertise
Unlock the potential of your business with our range of tech solutions. From RPA to data analytics and AI/ML services, we offer tailored expertise to drive success. Explore innovation, optimize efficiency, and shape the future of your business. Connect with us today and take the first step towards transformative growth.
You might also like
Stay ahead in tech with Sunflower Lab’s curated blogs, sorted by technology type. From AI to Digital Products, explore cutting-edge developments in our insightful, categorized collection. Dive in and stay informed about the ever-evolving digital landscape with Sunflower Lab.