Embracing the Power of Data
Crunching numbers and analyzing data has been going on since businesses have become a competitive field. Data is what empowers all the organizations across the world, without it, everything may seem like a black and white era of cinema again. Now the real question one may ask is if data is so vital for the needs and production of successful businesses, is that all? One has all the data, now is he or she the master? The answer is yes and no.
While Business intelligence and data visualization software have made it simpler for analyzing data, the actual hurdle for most of the business owners and CEO’s is choosing the right BI analytics for all data which they have in their arsenal. Thus, collecting and mining the data is only the beginning of your efficient journey towards a steep development in all your departments. Choosing the right tool and methods to present that have an equal impact on your business decisions.
Power BI is now an established Business Intelligence tool for every type of enterprises, the adaptable and scalable capabilities make it a go to choice for all the companies who are looking for swift data processing and reporting with easy drag-drop dashboard creation in it. Further, a large number of integration features make it one of the best going BI analytics and BI reporting tool currently.
Identifying the Pillars of Power BI Reports

There is no shortcut to getting the most effective result out of your data, but with technology it has turned out to be much simpler, finding a needle in the haystack is not a myth anymore. Even with Power BI report development, one needs to implement the best steps to get the desired results. For that we have jotted down some of the most impactful procedures which you could execute in your organization.
Grasping the Data Requirements & Setting the Base
Some of the most crucial tasks in every reporting effort is this one. You have to understand the needs of your users and the data you are going to have access to before you start building anything. This section of the first step is frequently neglected. Always keep in mind that the end consumer requires insights, not just a big chunk of the data in your database. Before doing anything, try to comprehend both the end user and the data.
Make sure to not rush this as every other aspect will depend on how well you understand the company, the user, the issue you were attempting to resolve, and the data.
Connecting the Data
After collecting what you require, you should start exploring how to link to your data sources. You can link to an extensive range of data types using Power BI. Common sources of data like an Excel file or CSV belong to these sources. Furthermore, you could link to online resources like Salesforce, Microsoft Dynamics, Azure Blob Storage, and a lot more which hold multiple kinds of data.
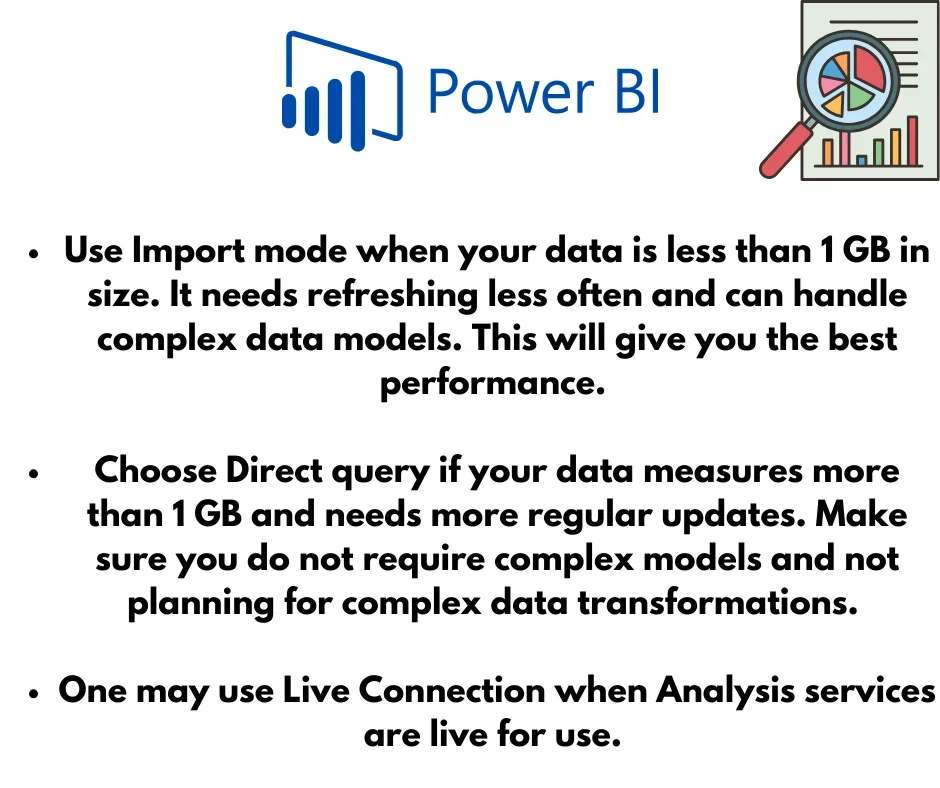
It’s crucial to decide the kind of connection you’ll utilize when accessing data. Import, Direct Query, and Live Connection are the three distinct types of connecting modes.
So now we have established how to decide on the best connection type according to your business types.
Refining Data with ETL
Data Cleaning is an important part of producing the best Power BI reports for your organization. Before using the data in the report, it should be processed once it has been imported because the raw data needs to go through several transformations. While complex transformations can be handled with the Advanced Editor, Power Query operations can be completed rapidly.
Data Modelling
The method of modeling data tables is called data modeling. When working with relational databases, you are likely to come across data that is stored in a number of linked tables. With the Power BI data model window, we are able to create a schema with stars and snowflake structure. Utilizing the manage relationship icon on the Power BI modeling ribbon, you are able to quickly create a data model.
Data Visualization
When data is visualized, it becomes more interesting, and you become a skilled presenter of the details contained in your statistics. Data visualization facilitates the rapid and efficient development of insightful business strategies by users through the use of live data dashboards, interactive reports, charts, graphs, and other visual aids.
Maximizing Power BI Reporting Tool
For making the most of your data and Power BI report development, certain tips can create everlasting impact on how you handle and present your data.
Turning down the data volume
Ideally, you should filter your data at the source to prevent even importing rows or columns of information that are not required to address the particular questions that your report is meant to address.
If you are unable to modify the source, you can eliminate redundant rows from your data model using the row filter dropdowns and superfluous columns from your data model using Power Query’s choose columns button.
Go for Star Schema for Data Model
The most effective structure for your data model is a star schema. The simplest data model with dimensions or lookup tables above or around the fact table is the one you should always aim for. It is difficult to exaggerate the value of this star pattern because it helps you visualize the data model. Furthermore, it often allows the finest DAX and graphic performance.
Implementing Measure Branching technique
You could use measure branching as it is one of the best ways to develop DAX calculations. One could easily debug complex calculations as individual elements can be added to a validation table.
Developing Tables prior
The fact that many Power BI visualizations are actually just tables rendered in various formats is one of the most frequently overlooked facts about them. Designing a table which demonstrates the table correctly originally is one of the most effective methods to make sure that a visual display the data you want. Next, make a copy of the table and modify its visual representation to a desired format, like an area or bar chart.
Designing for Mobiles
Reports created using Power BI are intended to be dynamic. Board conferences and printed documents are examples of offline reporting methods that aren’t utilized in the new era of presenting and dashboard development. Report users can now get live, interactive reports and dashboards from any place around the world employing technologies like Power BI. Not only does this reduce the need for the printing process, but it also enables input from users into reports and feedback to the programmers.
Although most Power BI reports are phone-friendly by standard, the report developer has to develop a mobile-friendly version of the report and dashboard in order for users to access them on a mobile device in the optimum manner. This approach is simple but effective. Report pages could vary in terms of how they appear visually for mobile and desktop computers.
Designing mobile-friendly views for your dashboards and reports is an important milestone towards having Power BI implemented within your company.

Winding Up
Power BI reports, as we have seen, are something which looks very elegant and simple on the out, but it needs proper design and data programing for the best results. While they are ready to be designed and customized by even a non-programmer personnel, the best way to avoid potholes during the BI report development is to learn some of the best practices to create reports.
To master Power BI reports is all about initiating small things which has huge impact at the end. From setting up all the elements and properly refining your data to implementing the best data visualization practices. As a leading Power BI service provider, our expert can guide you with BI implementation in your enterprise of any scale.
Contact Our Power BI Experts today to know more and develop the most efficient Business Intelligence tool for your business needs.
You might also like
Stay ahead in tech with Sunflower Lab’s curated blogs, sorted by technology type. From AI to Digital Products, explore cutting-edge developments in our insightful, categorized collection. Dive in and stay informed about the ever-evolving digital landscape with Sunflower Lab.