Our Esteemed Clientele


By integrating the improved Power BI Reporting into your company, make a quantum leap into the future. Leading businesses praise our experience in Power BI services as business intelligence managed services are currently highly advised for increased productivity. Our Power BI experts are ready for you.
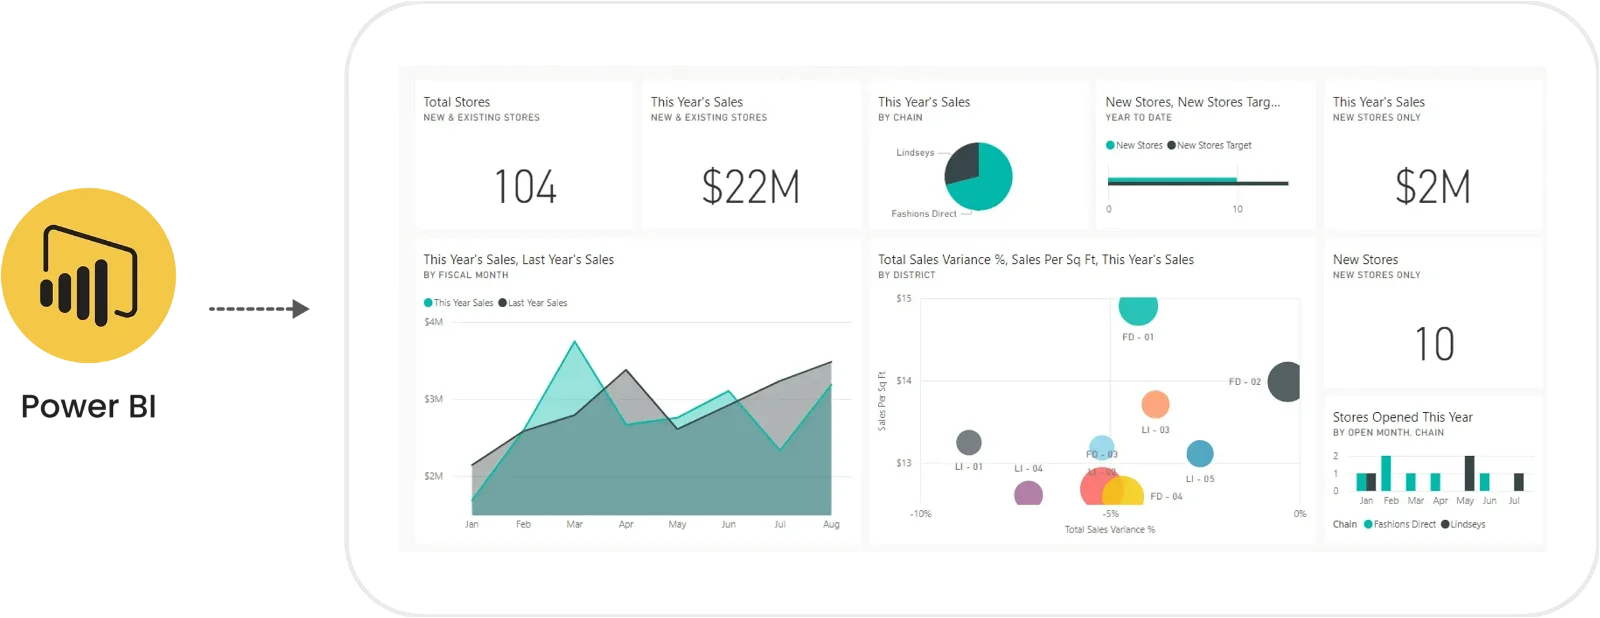
A Force in Power BI Services
By integrating the improved Power BI Reporting into your company, make a quantum leap into the future. Leading businesses praise our experience in Power BI services as business intelligence managed services are currently highly advised for increased productivity. Our Power BI experts are ready for you.
Into a New Era of Data Reporting
With Power BI Data Driven Reports, achieve a new power driven through data analytics and get ahead of your competitors. Know what makes them impactful.

Connect Data from Anywhere
You can access your data from a number of cloud-based sources like Dynamics 365, Azure SQL DB and SharePoint.

Easy Data Modelling
With Power BI, you can easily save a lot of valuable time with the presence of many data modelling tools, using Power Query ingest and transform your business data.

Advanced Analytics
With many innovative measures like grouping, clustering and forecasting, using DAX formula language, you can get deeper data insights than before.

AI-driven Insights
Just add your data and experience automatic data dive for pattern findings and future trends prediction which gives you the power of AI insights.
Interactive Reports
The design of your reports is now in your hands with easy drag-drop tools and simple formatting options which makes non-technical personnel a Power BI expert too.
What is Power BI Report Builder?
An innovative tool for creating paginated reports that you can publish to the Power BI service is what Power BI Report Builder is all about. Paginated reports can be printed or distributed. They display all the data in a table, even if the table spans numerous pages, and are formatted to fit properly on a page.
The report description you create when designing a paginated report specifies the data to be retrieved, where to find it, and how to show it. The data is retrieved, combined with the report structure, and generated by the report processor using the report definition you have set when you run the report. Using Report Builder, you can even preview your report.
Knowing the Building Process
Recognizing Data Sources
Firstly, you need to identify the data sources, from which you can derive information. “Get Data” feature enables you for the same. With this, you get modes to connect, Direct Query and Import Mode.
Data Cleansing
The data should be cleaned up after importing it before utilizing it in the report because it needs to go through several conversions. The Advanced Editor can be used for complex transformations, while Power Query can be utilized for quick ones.
Data Modelling
Next step involves data tables, you need to model these data and tables while they get stored in relational tables and databases. One could create a star schema using Power BI data model window.
Data Visualization
Power BI data driven reports are incomplete with data visualizations. The utilization of live data dashboards, interactive reports, charts, graphs, and other graphical representations allows users to rapidly and efficiently generate intelligent business decisions.
Publishing
After your report is generated and tested, you can easily publish it using the ‘Publish’ option from the toolbar and you will be provided with a link to view and share it.
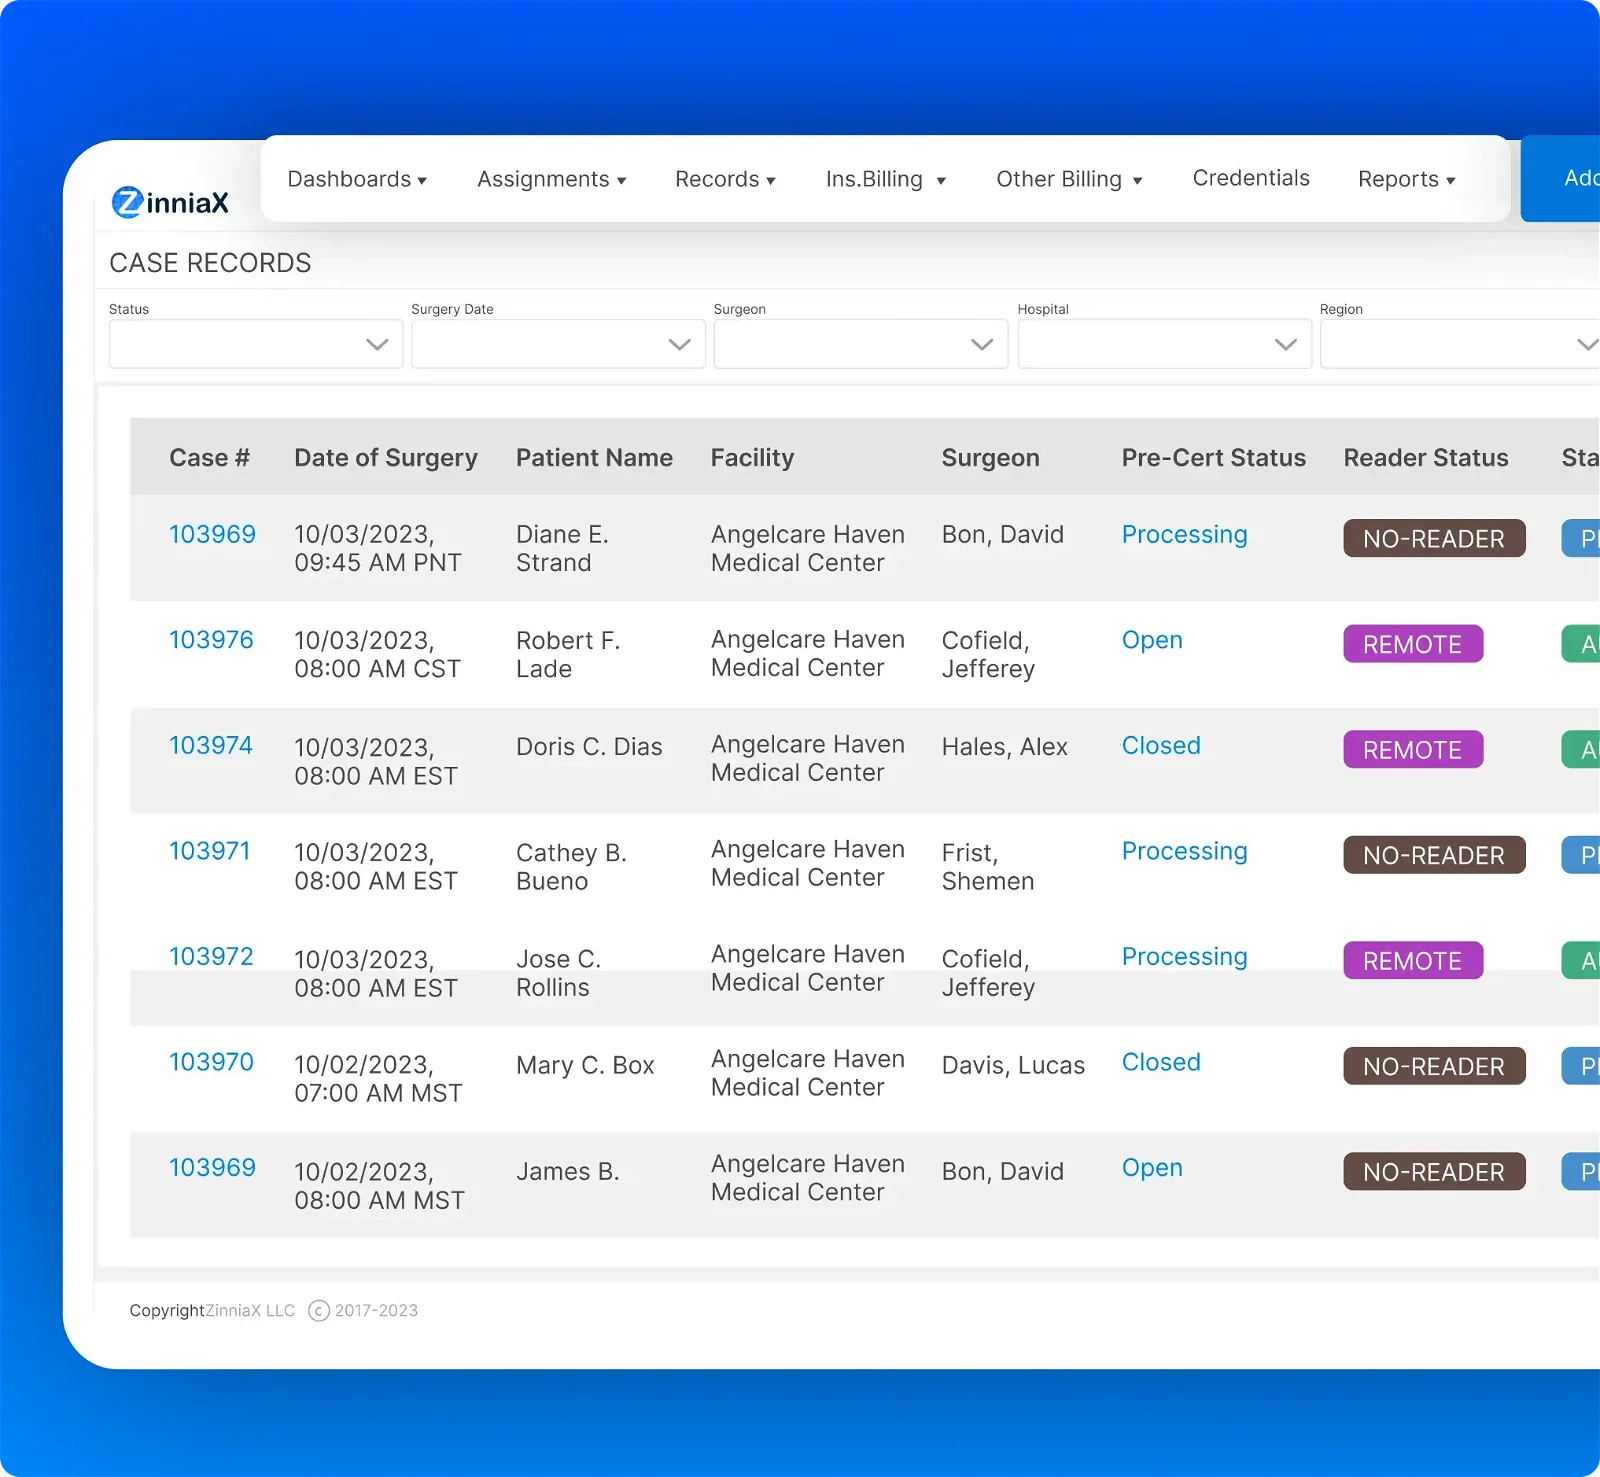
Power BI Dashboards for Persistent KPI Analysis on a modern Medical Application
Implementing RPA and Power BI reporting for detailed data analytics, claim management, and optimization of Electronic Medical Records. Upgraded monitoring of patient data can develop better diagnosis and management in the healthcare sector.
 Case Study - ZinniaX
"Zinniax has dramatically improved the efficiency of our operations. Repetitive and time-consuming tasks that used to take up a significant portion of the team's workday are now handled seamlessly by the RPA system. This allows to redirect of resources and manpower toward more strategic and high-value tasks. Your team's support throughout the development and implementation process has been exceptional."
Gene Boucher
Chief Operating Officer, Accurate Neuromonitoring
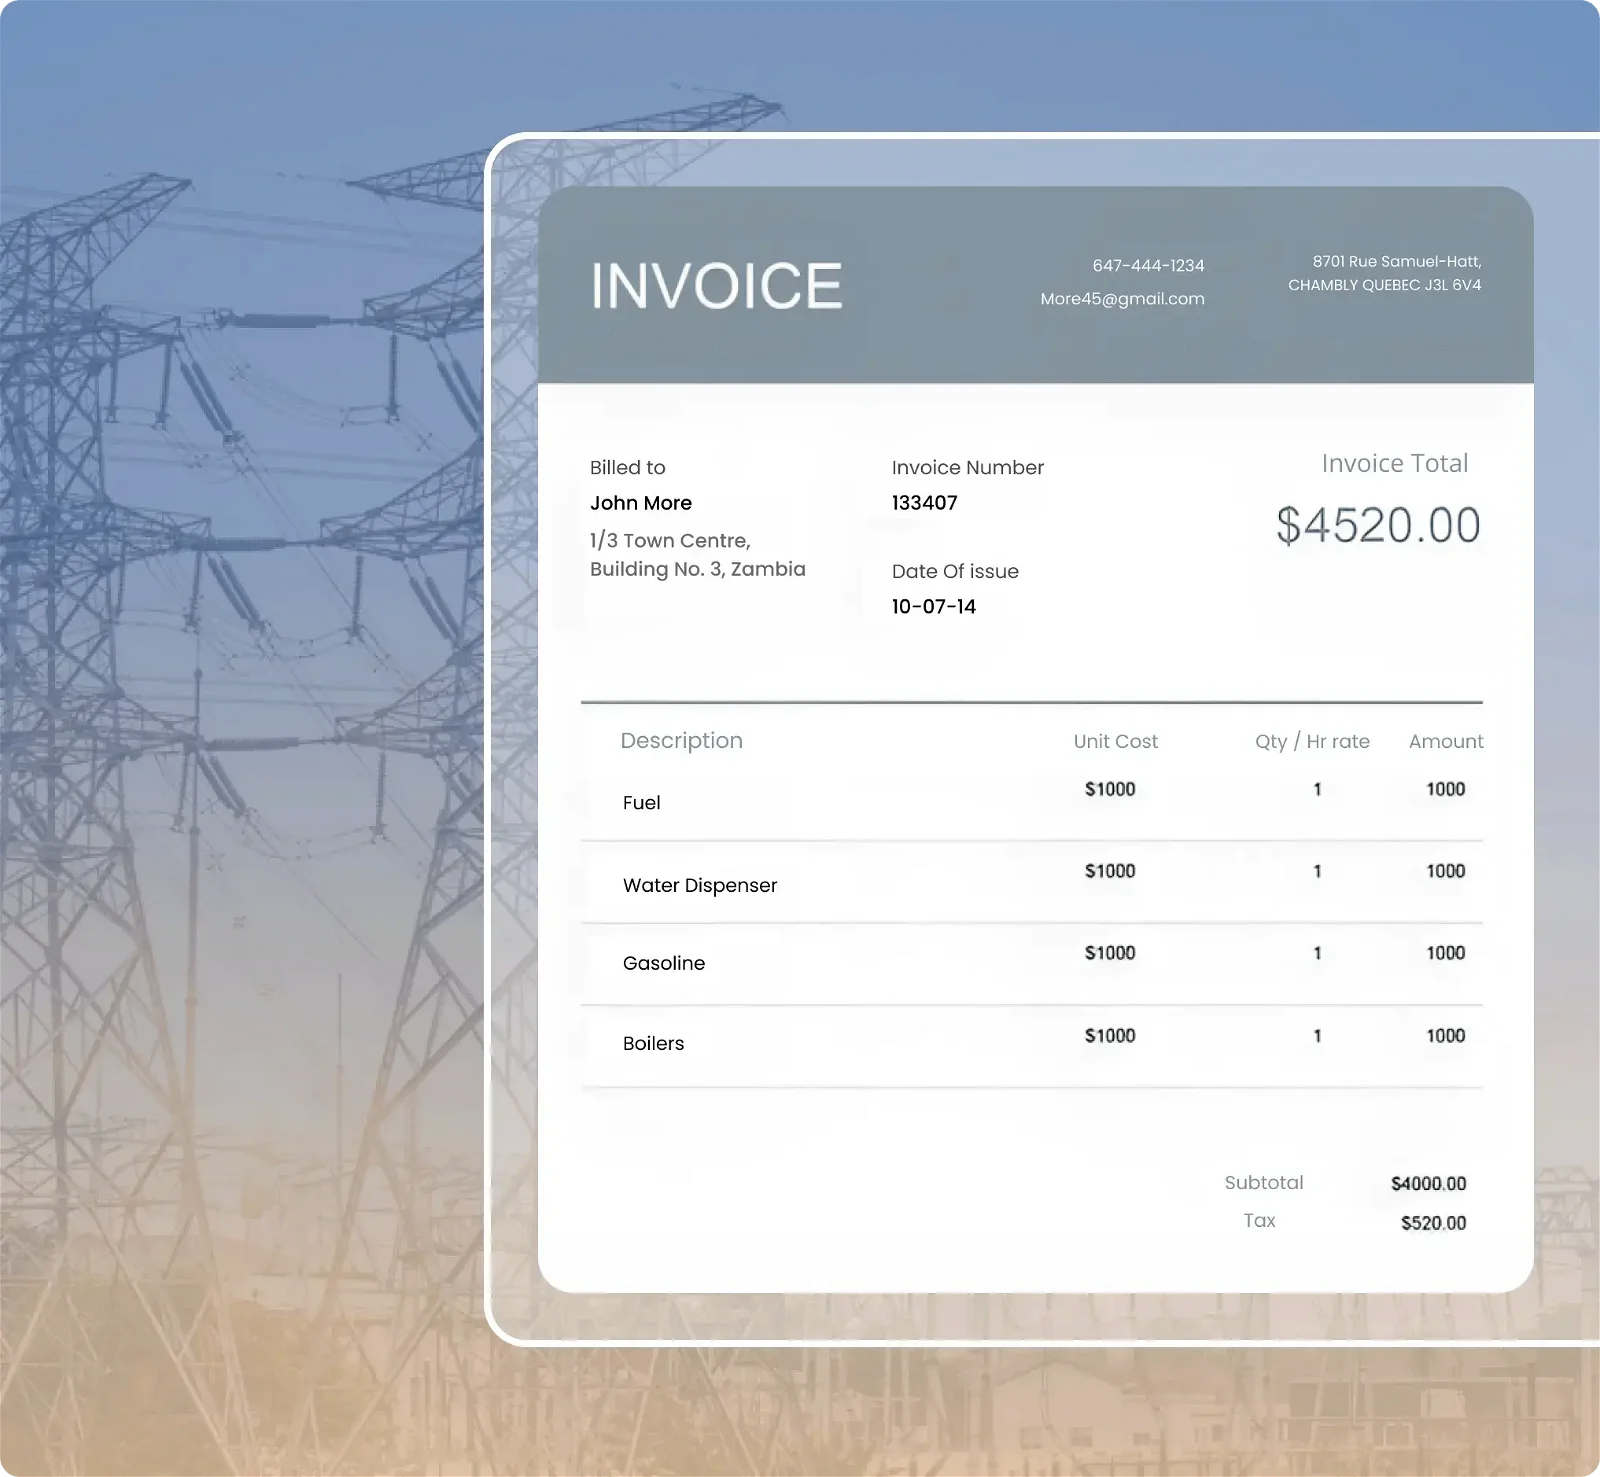
Fostering Power BI in Energy Industry
USE CASE– Energy Providers
With the use of Power BI, you can integrate meter inventories, readings, and client billing. Analyse meter flags and suspect consumption trends in addition.
Familiarizing Power BI Report Server
Users can access rich, interactive reports as well as SQL Server Reporting Services’ enterprise reporting features through Report Server. To make more intelligent judgments more quickly, explore graphical data and easily spot trends.
Create the pixel-perfect paginated reports your company requires at the same time. Power BI Report Server is based on a tried-and-true, enterprise-grade platform, so you can scale to thousands of users with confidence.
Boost Retail Growth with Power BI
Retail is a sector that can benefit from industry-specific Power BI solutions that include inventory updates, stock report creation, cashflow insights, and warehouse and seller updates.
USE CASE - Retail


Upgrading Medical Care with Power BI
USE CASE – Healthcare
You can get several potential upgrades with Power BI services, including tracking patient testing/demands, insights from medical data, and resource optimization.
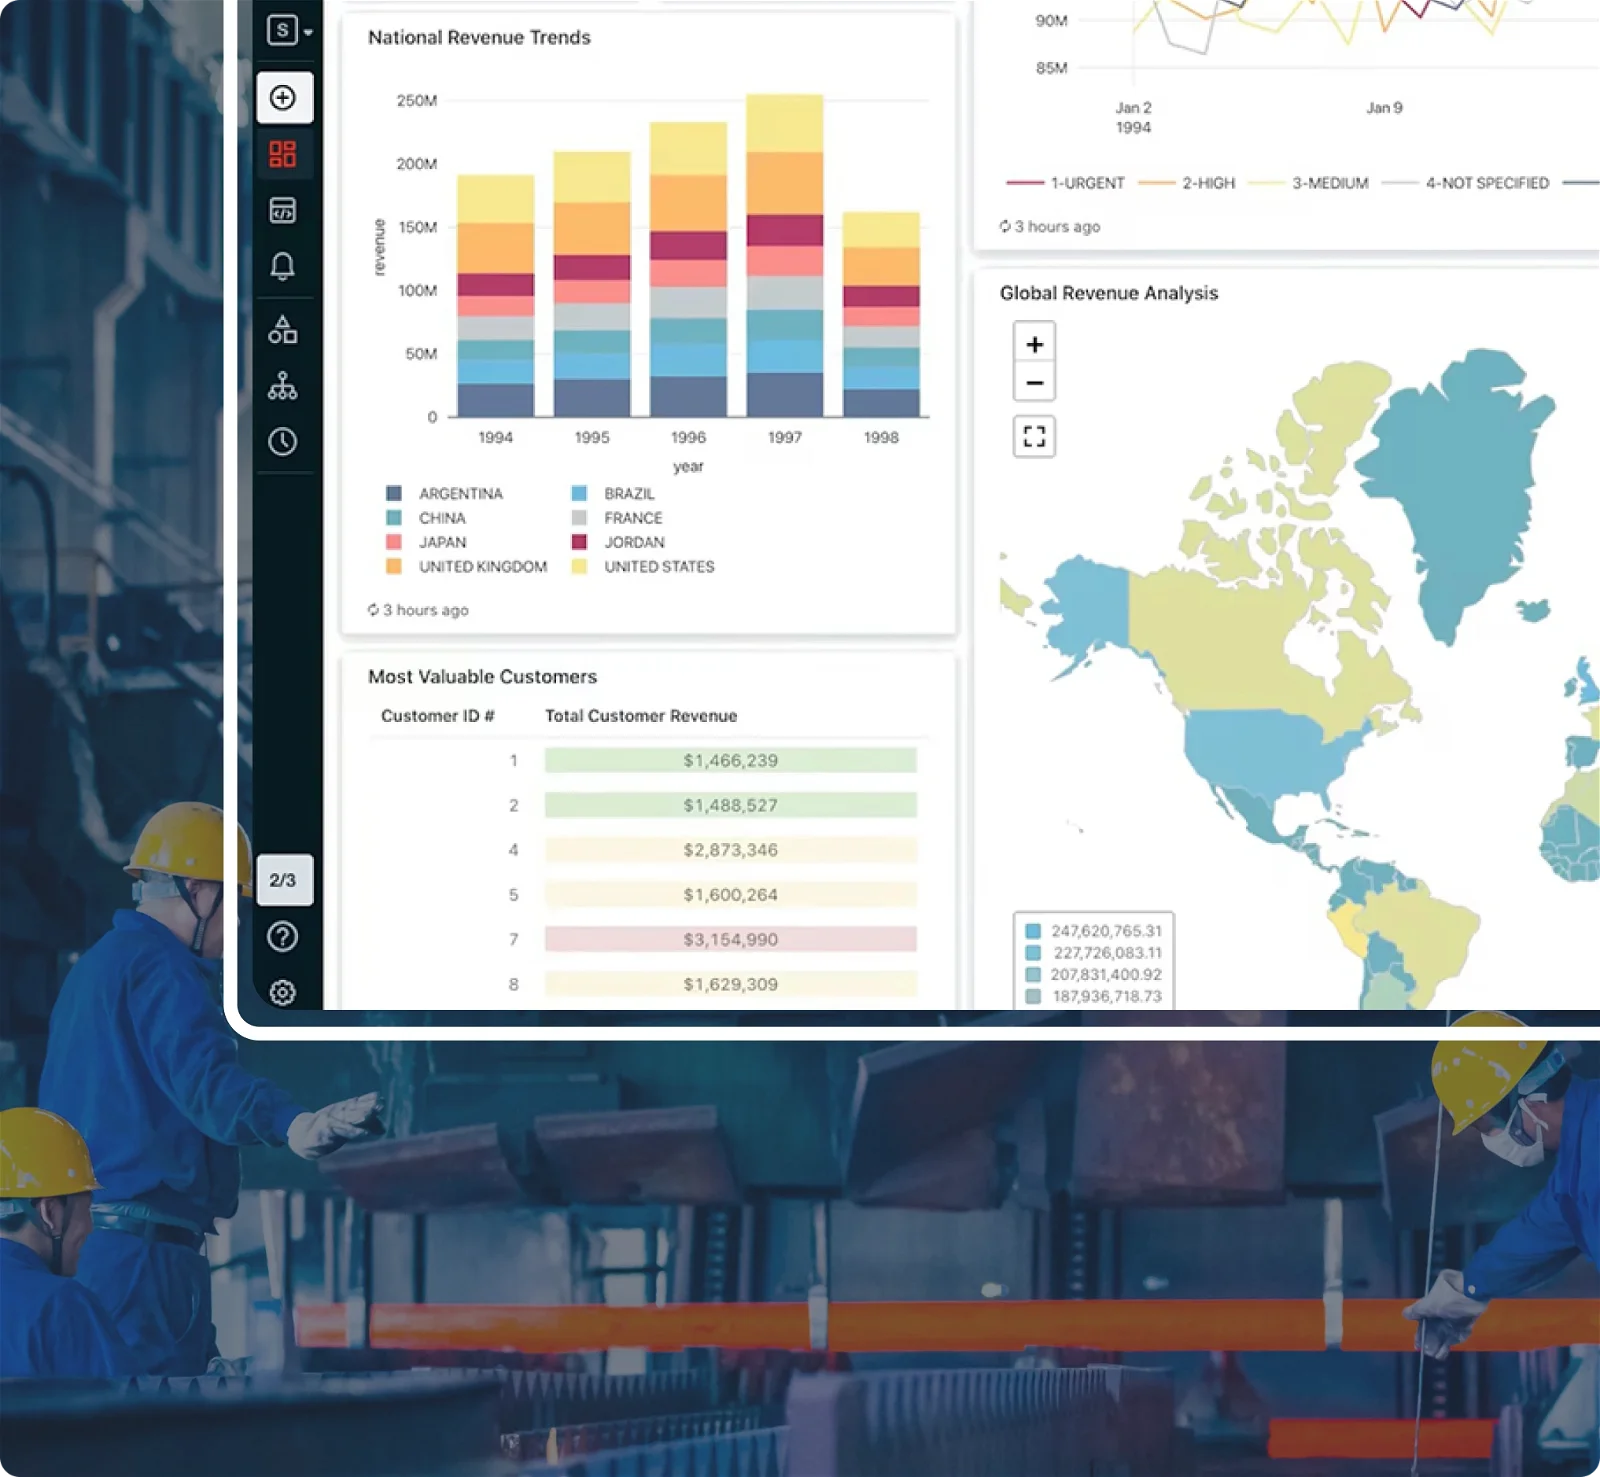
Modernizing Manufacturing through Power BI
Contact Power BI professionals right now for help automating and publishing paginated reports, categorizing crucial reports, production analysis, trend data, and more.
Case Study - Manufacturing
Our Certified Partnerships
Sunflower Lab has achieved a significant milestone by becoming a recognized consulting partner by Microsoft and with Azure Databricks, a leading analytics and machine learning platform. This collaboration combines advanced analytics with Azure Power BI for data-driven decision-making, operational efficiency, and improved competitiveness, fueling business growth and success.
Explore Our More Capabilities
Teams & Achievements
15+
Years Of Experience
250+
Projects Completed
96%
Customer Retention
150+
Team Strength
Connect your data from all the data sources and achieve insightful data analysis to transform your business.
Your Go-To Resource for Answers & Insights
Our Power BI data modeling service offers a comprehensive range of features, including data import from various sources, data transformation and cleansing, creating relationships between data tables, defining custom calculations with DAX (Data Analysis Expressions), designing data hierarchies, optimizing data models for performance, and integrating data with interactive and insightful visualizations for enhanced data analysis.
Using Power BI’s data modeling service is a structured process. First, we import data from your chosen sources. Then, we transform and shape the data to meet your analytical needs. We create relationships between different data tables, ensuring data consistency. Finally, we design intuitive and interactive reports and dashboards using Power BI’s visualizations. These reports provide you with actionable insights, which you can use to make informed business decisions.
Creating a data model in Power BI involves several steps. We start by importing your data into Power BI Desktop. Then, we define relationships between tables by specifying primary keys and foreign keys. Next, we create calculated columns and measures using DAX to perform calculations and aggregations. Finally, we design visuals and reports that leverage the data model to visualize insights effectively.
Power BI data modeling empowers you to gain valuable business insights by transforming raw data into a structured, easy-to-understand format. With well-defined data models and interactive dashboards, you can analyze trends, identify patterns, track key performance indicators (KPIs), and make data-driven decisions. This enables you to optimize processes, improve efficiency, and ultimately drive business growth.
Power BI data modeling offers enhanced data accuracy, efficient analysis, and improved visualization, enabling data-driven decisions and process optimization. Its scalability and integration capabilities create a comprehensive data ecosystem, fostering collaboration and insights sharing across your organization, ultimately driving business success.
From Ideation To Support, We Partner With You All The Way
Contact our team of experts today!

