Our Esteemed Clientele




Our experts at Sunflower Lab can create interactive dashboards and reports that transform your business data into intelligent data through the power of Power BI. Imagine if you could see your inventory, backlog, revenue, pipeline, bookings, orders etc. All in one dashboard? And that dashboard would dynamically update with real-time figures? Our experts in Power BI, can help your business leverage its full potential by adding dynamic options like forecasting. This will ensure that the next time you make a decision for your business you make an informed one.
Data Analysis With Real-Time Business Intelligence
Our experts at Sunflower Lab can create interactive dashboards and reports that transform your business data into intelligent data through the power of Power BI. Imagine if you could see your inventory, backlog, revenue, pipeline, bookings, orders etc. All in one dashboard? And that dashboard would dynamically update with real-time figures? Our experts in Power BI, can help your business leverage its full potential by adding dynamic options like forecasting. This will ensure that the next time you make a decision for your business you make an informed one.
Partnerships
Sunflower Lab Secures Partnership with Azure Databricks for Power BI Development. By being accepted as a recognized consulting partner by Azure Databricks, Sunflower Lab has accomplished a big landmark. We are dedicated to utilizing our connection with Databricks to provide top-notch Power BI development services, assist our clients with data optimization and storage, help them uncover insightful information, and improve data access for their company’s success.
Power BI App Development Services
Grant Your Business the Power of Power BI for Better Data Analysis, Integration, Visualization and Collaboration Introducing the power to identify trends and patterns in business data in the real-time.
Power BI Dashboard Development
Informed decisions are integral to business success. As a Power BI development company, Sunflower Lab assists businesses by creating dashboards that give them an overview of real-time information instead of yesterday’s figures.
DAX In Power BI
Our team will further enhance your Power BI dashboard with the use of DAX queries which will allow dynamic queries and time intelligence. This allows the performance of complex calculations and data analysis with comparative ease.
Power BI Integration Services
Power BI can be integrated with SharePoint, Excel, and Dynamics 365 to name a few. Our experts can add other databases as part of your own product. We can customize the dashboard as per your preferences.
Power BI Reporting
It is possible to access Power BI on the go through mobile. This makes the data easier to view as well as analyze. Our experts can integrate Power BI with other Microsoft Tools so that users can import data and then share reports easily.
Power BI Data Modeling
We can customize Power BI to reflect complex data models as it has advanced modeling capabilities, collaboration, sharing features, and integration with other tools.
Power BI Migration
This feature is perfect during data-related migration as the data then needs to be consolidated onto a single platform. We can ensure the smooth transition of data during migration and test the efficiency of the same.
Power BI Maintenance & Support
Dashboards and reports only make sense when they are up to date. We ensure that we build dynamic dashboards as this helps clients get real-time interpretations of their data. Since they refresh automatically it reduces manual data maintenance.
Power BI Consulting
Our team will work closely with you to understand the needs of your business and factor in how Power BI can be used to increase operational efficiency through spotting of trends and anomality's.
Collaborate with our Power BI professional developers to unravel hidden insights and drive success.
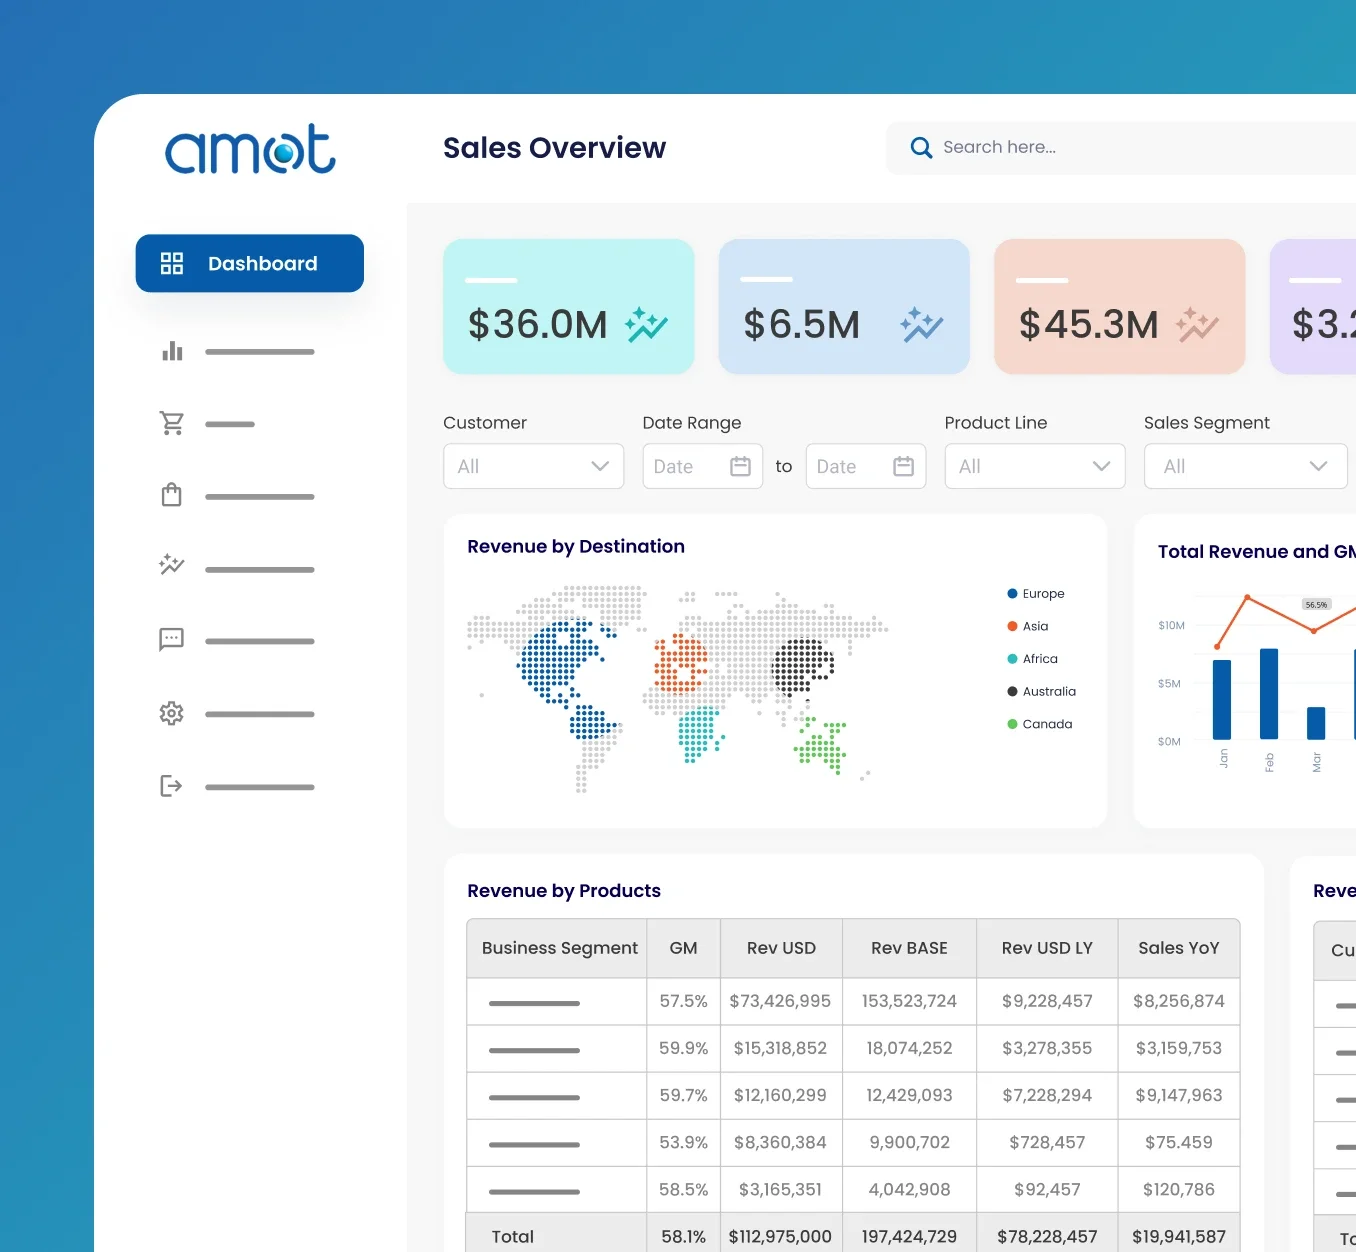
Optimizing Manufacturing Operations through Power BI
Case study - Amot Power BI
Instead of struggling with key business metrics like revenue, inventory, bookings, and backlog, AMOT a leading manufacturer of thermostatic control valves choose instead to empower their business. With the power of Power BI dashboards and real-time data, they now have the required visibility and control to make the best of every opportunity through informed decisions.
Power-Packed Features Of Power BI
Power BI is designed to be easy to use as well as intuitive so that users can easily access reports and dashboards quickly. If users want to add customizations later there are easy drag-and-drop features provided. When it comes to business or CRM applications, businesses prefer models that are on-the-go and hence, mobile friendly. Power BI is compatible on this front as well. For more information on Power BI and its features, read our blog on Power BI.
As any Power, BI development company will tell you, Power BI can be easily integrated with commonly used Microsoft apps which include, Excel, Teams, SharePoint, Azure, and Dynamics 365. This makes it easy for users when it comes to the analysis, sharing, and access of data across multiple platforms.
Data is difficult to read through and thus, with the help of visualizations, it becomes easier to process large chunks of data. Some examples of the data visualizations available are column charts, stacked bar charts, tree maps, pie charts, etc. There are other visualization maps present too. Power BI is flexible and allows for the easy customization of the graphs and charts that are available.
Power BI boasts of being on-the-go which is why it provides ample cloud-based solutions. These include Power BI: service, embedded, premium, mobile, and data flows. Service provides a cloud-based solution for sharing, collaborating, and publishing while embedding allows integration of dashboards, and reports in your websites or applications. For more information on Power Tools and BI and their features, read our blog on Power BI.
Since Power BI provides an easy sharing interface and integrates with other Microsoft products, it allows collaboration among team members. Users can easily collaborate and work on reports and dashboards which can be shared with specific individuals or groups. Comments and annotations within reports are also supported. Due to its easy integration, reports can even be shared in Microsoft Teams, for instance among other Microsoft tools.
There is a whole host of powerful data modeling features from hierarchical data modeling to time intelligence modeling and data blending Power BI also offers. Advanced calculation features such as DAX (Data Analysis Expressions) and data normalization. Since Power BI allows for data to be shared through various channels, it uses data normalization so that the data remains consistent and comparable.
Mobile app that is optimized for mobile devices, and it allows users to access their data securely using the same authentication methods and security protocols that are used in the Power BI service.
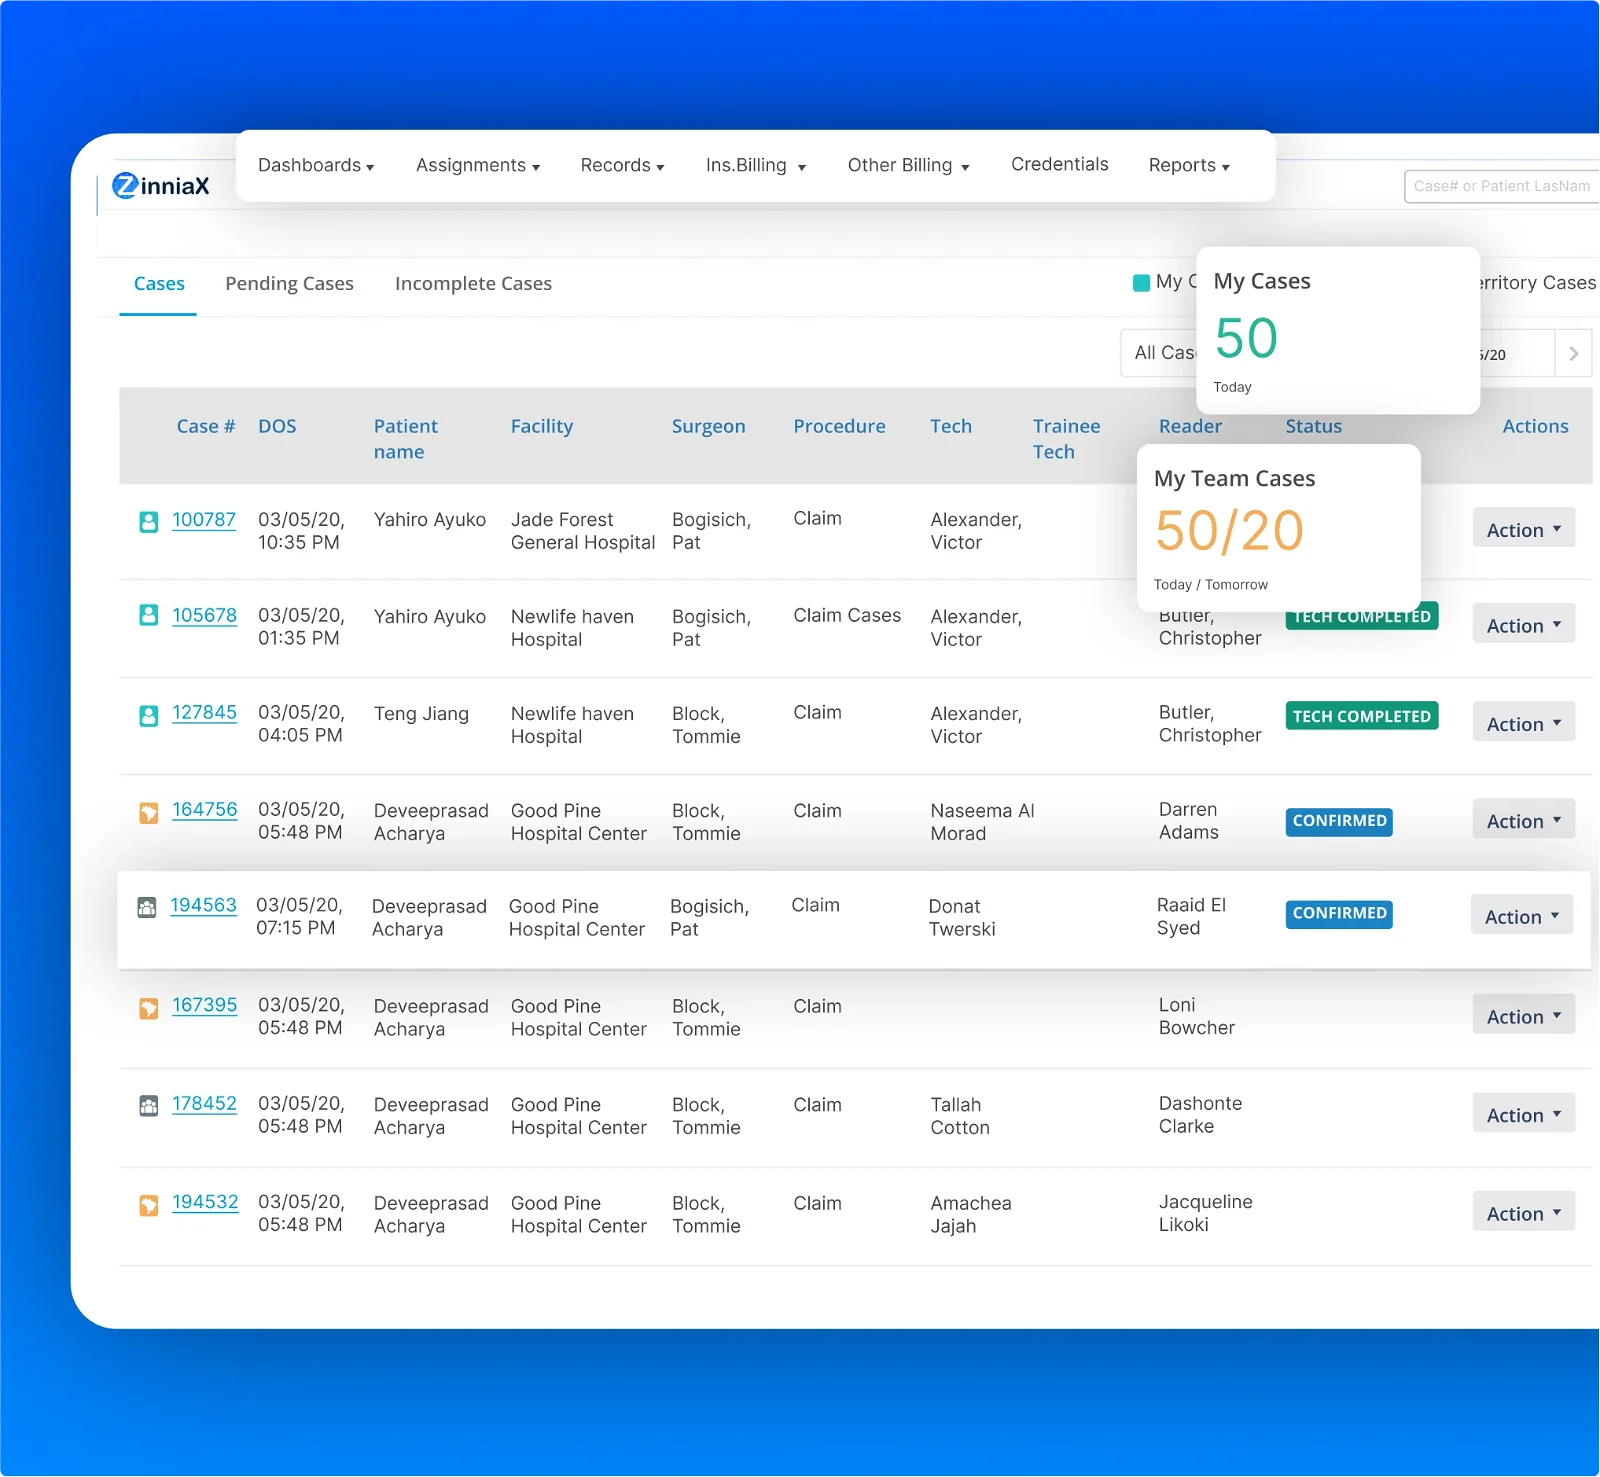
A SaaS Healthcare Platform Empowered by Power BI Dynamic Dashboards for Real-time KPI Analysis
Case study - Zinniax
Using RPA for comprehensive data analytics, claim management, and streamlining of Electronic Medical Records. Better monitoring of patient history leads to better diagnosis and healthcare management.
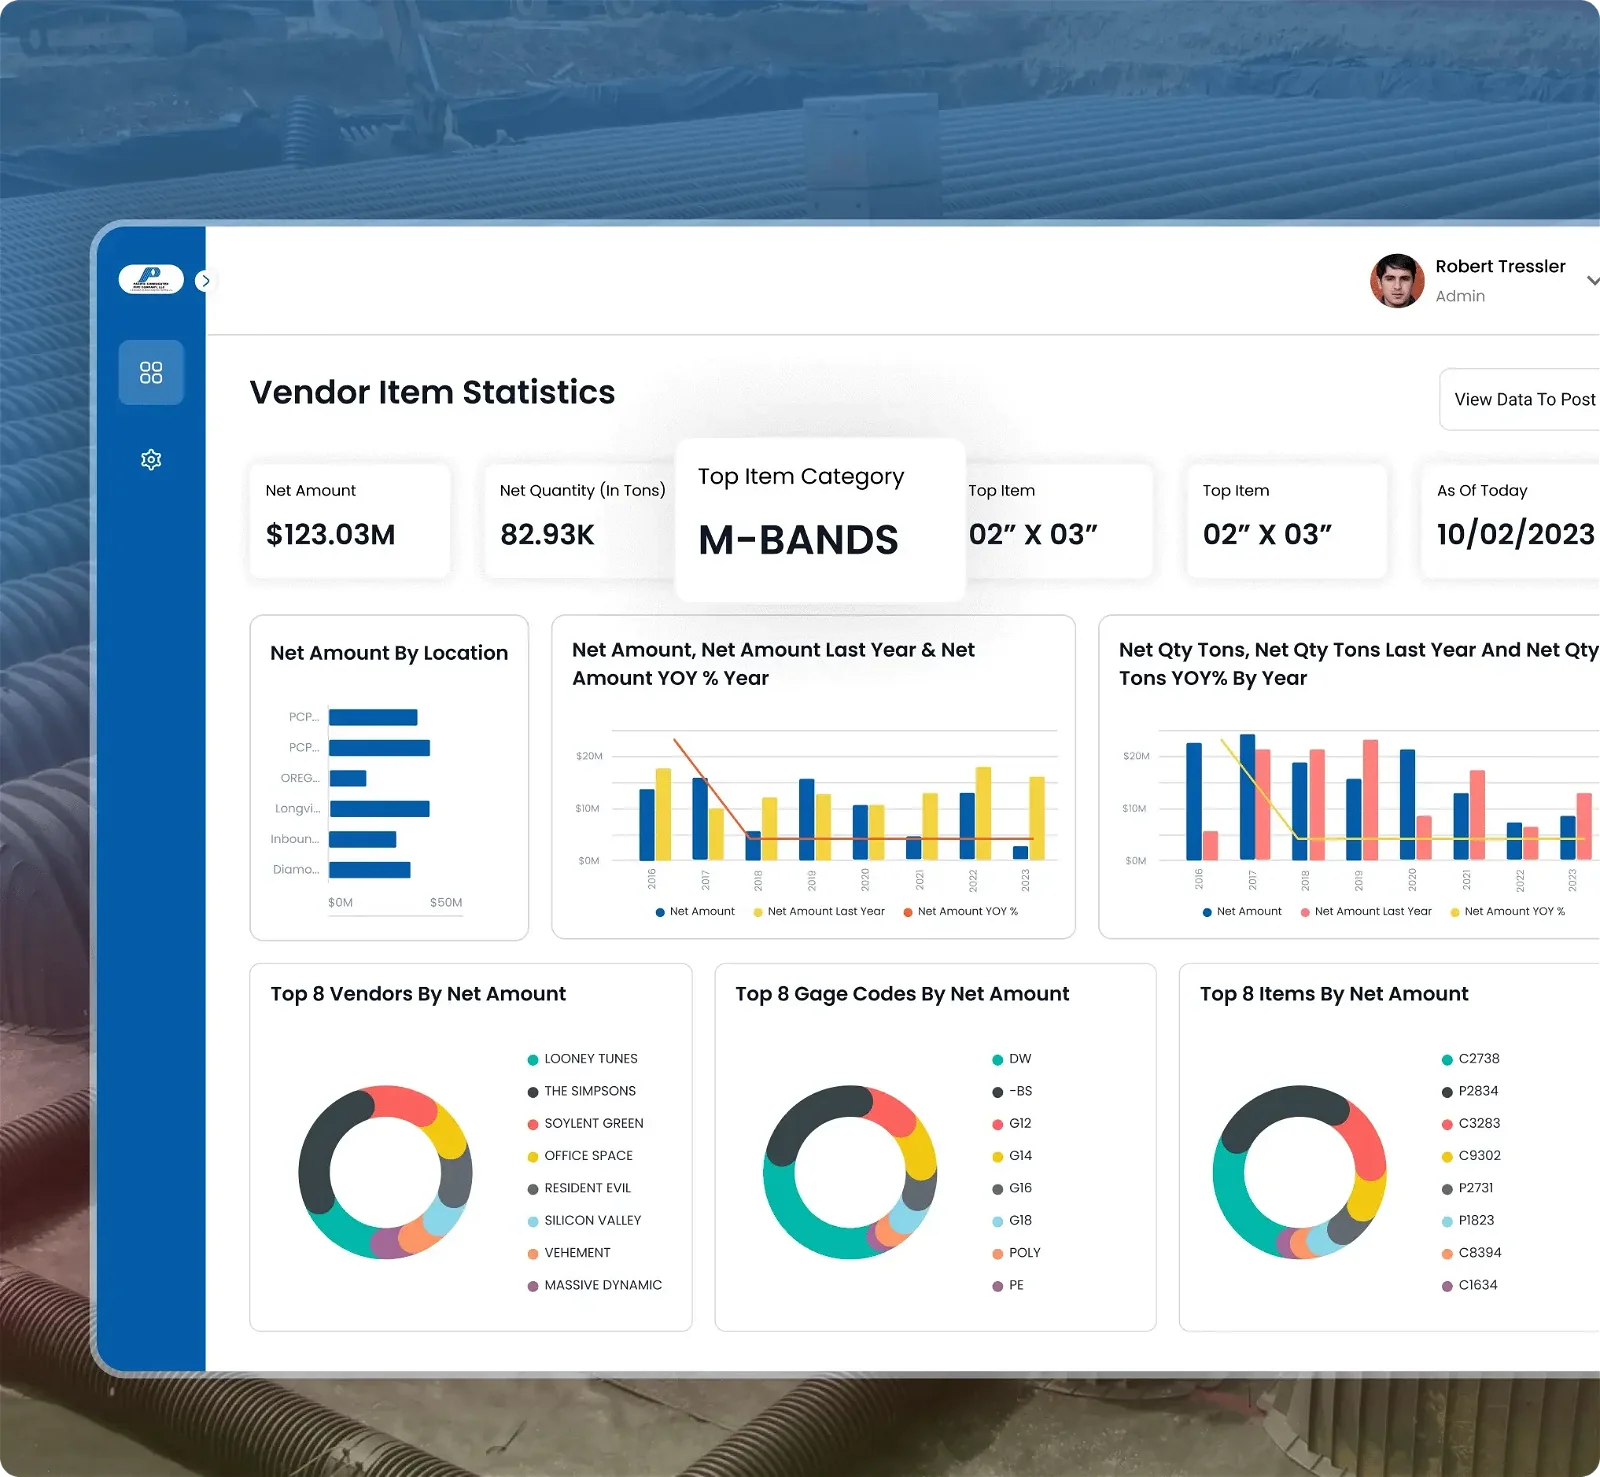
Data Service in Pipe & Storm Chamber Company for Power BI Reporting
Case study - PCP Company, LLC
A product for upgrading data management for which we used Synapse Analytics to develop pipeline to move data from on-site data server to data lake on schedule basis and then integrate that data in power BI reports which enhanced their all-round business operations

testimonials
Although Sunflower Lab is still working on the project, they establish a coherent roadmap for the engagement. The team maintains a strong understanding of the business, which allows them to create effective solutions.
Gene Boucher
Zinniax
Uncover trends and insights with our Power BI Expert. Elevate your data game.
Power BI Trends
Power BI was once only accessible to leading companies. These were those companies that were able to access Big Data. However, with Power BI development services things have changed. With Power BI now being accessible to all, more and more businesses are realizing the true potential of data analysis and visualization. As businesses realize the potential that dynamic dashboards and real-time reports offer, data centralization and on-the-go data accessibility are the kind of power package that rarely grows old.
Quality Management
The quality of data is now of paramount importance and mere raw data is not enough – a business needs to know what to do with it. Data of good quality should be consistent, correct, and up-to-date.
Decision Making
Informed decisions require quality data. Also, quality data requires proper analysis so that a proper interpretation is made and only data that is relevant and beneficials for the business is being tapped into.
Discovery and Visualization
Big Data is vast and so it is important that only information of use is taken from the raw data. By collecting insights and transferring the same into a visual form it becomes easier.
Data Governance
Data is very important when it comes to BI and so, data governance is a requirement as it deals with the way the data is managed, analyzed and implemented.
Self Service
In order to make BI accessible to all a move is being made to create Self Service Business Intelligence (SSBI). Thus, a business will not require a separate team to analyze the data once the models are in place.
Embedded BI
Power BI is being increasingly embedded within custom applications and portals to deliver embedded analytics capabilities. This allows organizations to integrate Power BI dashboards and reports.
Business Intelligence has the capability to empower business owners in making more informed decisions. Power Tools allow for automation which was at one time undreamed of and now ow s increasingly becoming regular. Read our detailed blog on g on Power tools for more information on the same.
Partnerships

Sunflower Lab has achieved a significant milestone by becoming a recognized consulting partner by Microsoft. We are committed to leveraging our Microsoft partnership to deliver top-notch Power BI development services and help our clients optimize their data and unlock valuable insights for their business success.
Teams & Achievements
15+
Years Of Experience
250+
Projects Completed
96%
Customer Retention
150+
Team Strength
Business intelligence does not just improve operational efficiency but also lets you in on trends, anomalies and KPIs. Contact our Power BI Developer USA.
Frequently Asked Questions for Power BI
Power BI provides a powerful combination of analysis and visualization. Through this it provides dynamic reports and dashboards that are updated in the real-time. Basically, it provides Powerful Business Intelligence which eventually translates into better business decisions, more accurate data insights and more efficient collaboration. It promotes data-driven decision making.
The most integral feature of Power BI is that it centralizes data from various sources be it spreadsheets or cloud sources. Thus, through its dynamic dashboards you get a bird’s eye view of the business to make informed decisions.
Through interactive dashboards you can visualize data in the real-time and identify trends, track key performance indicators as well as make decisions backed by solid well analyzed data.
To get the best out of the expertise of a Power BI development company it is important to optimize it as per the specific needs and requirements of the business. Thus, the first step here would be defining the same. Key performance indicators and other business metrics are identified through the tracking of data sources. It is important that these requirements are aligned with the objectives of the business.
A data model is designed and the appropriate visualizations are selected.
While Power BI development services will ensure that you have everything ready in record time, the scope and complexity of the project need to be factored in when creating a timeline. Since Power BI consists of data centralization the number of data sources, the transformation required, and the quality of the same would also impact the time taken for development. Most Power BI solutions are developed within the range of a few weeks to months depending on the specific user requirements are well.
Also, the complexity of the dashboard too would impact the timelines. This would include the number of visualizations, interactivity as well as custom features that are required. Also, there could be the additional time that is required for the integration of other tools.
Expertise and experience are a combination as powerful as Power BI. People prefer to opt for a Power BI development company as they get a better deal when it comes to exploring the full potential of Power BI. Our experts have over 10 years of experience working with various technologies and industries. They can provide you with invaluable advice on the features, capabilities, best practices, and the level of customization possible.
Furthermore, Power BI’s full potential can only be realized when it is customized to fit your business needs and any specific requirements that your business may have. We work as your partner through ideation, discovery, and deployment while at the same time providing end to end support.
From Ideation To Support, We Partner With You All The Way
Contact our team of experts today!


