In today’s dynamic retail landscape, where data holds immense value akin to currency, the clarity offered by a comprehensive dashboard isn’t merely a luxury—it’s a necessity. Executives face a deluge of data, yet the true power lies in transforming this data into actionable insights. This is where marketing dashboards, especially those fueled by a robust business intelligence tool like Power BI, emerge as game-changers with Power BI experts
Reach Your Retail Marketing Campaign Goals with Power BI Service
In the retail industry, rapid analysis and action on trends can truly transform the game. Power BI service empowers sales and marketing teams to craft impactful campaigns that draw in more customers. Achieving your retail marketing campaign objectives can be greatly enhanced by adopting an effective Power BI development services.
As data-driven marketing gains momentum, having real-time insights becomestop-notch. Power BI enables marketers to visually interpret their data effectively,helping a deeper understanding of customer behavior and trends.
Can Power BI be used for Marketing?
Microsoft Power BI is a powerful business intelligence platform that marketers use to turn raw data into actionable insights for marketing success. Its strength lies in consolidating data from various sources like CRM systems, social media, email tools, and website analytics. By unifying this data, Power BI solutions provides marketers with a comprehensive view to better understand their marketing performance across all channels.
Types of Power BI Marketing Dashboards
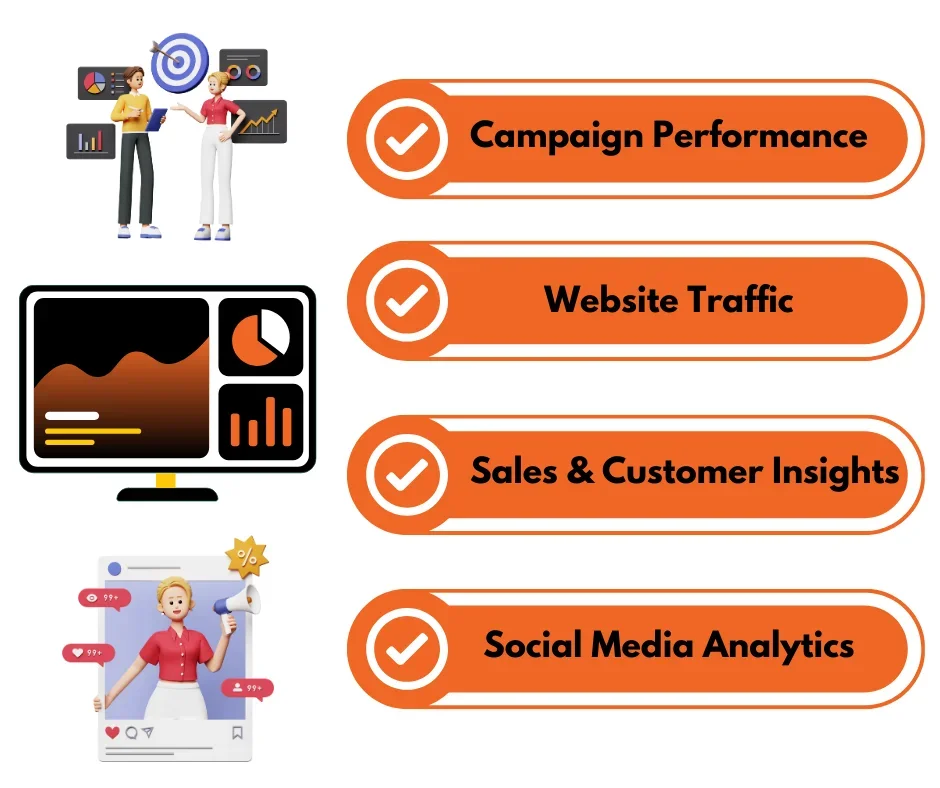
Campaign Performance Power BI Dashboard
One of the primary function in the Power BI marketing dashborad is how it contains various metrics to simplify the campaign performance monitoring.
Campaign Performance Power BI Dashboard
Reach: This metric indicates the number of unique users who viewed the campaign content across various channels (e.g., post impressions on social media, email opens in email marketing).
Engagement: Depending on the data sources, channel, this category may cover different metrics:-
- Social Media: Likes, shares, comments, click-through rate (CTR) on post links.
- Email Marketing: Open rate, click-through rate on email CTAs.
- Paid Advertising: Click-through rate on ads, impressions, and conversion rate (percentage of clicks leading to desired actions like purchases or sign-ups).
- Conversions: This metric shows the number of users who took a desired action after engaging with the campaign, like making a purchase, signing up for a newsletter, or downloading a white paper.
- Cost per Acquisition (CPA): This metric calculates the average cost of acquiring a new customer through the campaign. It is computed by dividing the total campaign spend by the number of conversions.
- Return on Investment (ROI): This metric illustrates the financial gain of the campaign. Typically, it is found by subtracting the campaign cost from the revenue generated by the campaign, dividing the result by the campaign cost, and multiplying by 100 to present it as a percentage.
Interactive dashboards in Power BI gets influenced by its data visualization abilities.
Visualizations:
- Line chart: Track key metrics like reach, engagement, and conversions over time to spot trends and fluctuations in campaign performance.
- Bar charts: Compare different channels or campaign elements side-by-side for easy performance comparisons across campaigns or content types.
- Maps: Visualize campaign performance by geographical locations to understand regional trends and target audience demographics.
- Tables: Provide detailed campaign data breakdowns for in-depth analysis and filtering based on specific criteria.
Impact
- Identify high-performing and underperforming campaigns: Marketers can quickly compare metrics across channels and campaigns to determine the most successful ones in terms of reach, engagement, and conversions. This helps allocate resources effectively to boost successful campaigns and improve or stop underperforming ones.
- Real-time insights: Power BI marketing dashboards update in real-time, enabling marketers to make data-driven decisions and adapt ongoing campaigns promptly instead of waiting for static reports.
- Budget optimization:Understanding the cost-effectiveness of various channels and campaigns allows marketers to optimize budget allocation by prioritizing channels with the highest ROI.
- Content strategy refinement: Analyzing engagement metrics for different content types helps marketers identify audience preferences, refine their content strategy, and create more engaging content for future campaigns.
- Improved reporting:Power BI implementation offer a clear and concise way to communicate campaign performance to stakeholders, promoting data-driven discussions and gaining support for future marketing endeavors.
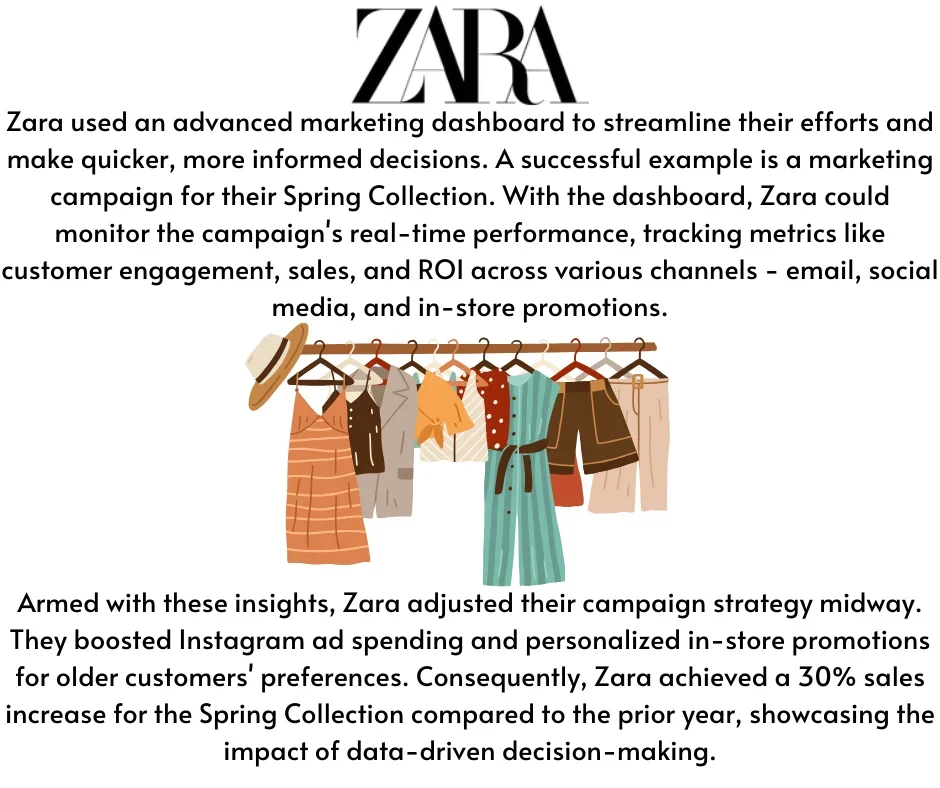
Real Time Success
Website Traffic Power BI Dashboard
Traffic Sources:
-
-
- Organic Search: Visitors who came through search engines like Google or Bing.
- Direct Traffic: Visitors who directly entered the website address or bookmarked it.
- Referral Traffic: Visitors who arrived from links on other sites.
- Social Media: Visitors who clicked on links shared on social platforms.
- Email Marketing: Visitors who clicked on links in marketing email
-
User Demographics: This section offers insights into website visitors based on demographics such as:
-
-
- Location: Geographical location (country, city, region) of visitors.
- Age: Age range of visitors.
- Gender: Gender of visitors.
- Device: Type of device used to access the website (desktop, mobile, tablet).
- Page Views: Total number of times individual website pages were viewed.
- Bounce Rate: Percentage of visitors who left the site after viewing just one page.
- Conversion Rate: Percentage of visitors who completed a desired action, like making a purchase, signing up for a newsletter, or downloading a document.
-
Visual Data:
-
-
- Pie Charts: Show distribution of traffic across different sources, giving a quick overview of website visitor origins.
- Stacked Bar Charts: Compare traffic sources or user demographics over time, making it easy to spot trends and shifts in visitor behavior.
- Heatmaps: Visualize user behavior on specific pages, highlighting areas of high and low engagement and clicks to pinpoint navigation issues or content gaps.
- Gauge Charts: Display bounce rate and conversion rate metrics visually, offering a quick view of performance and areas for enhancement.
- Understanding user behavior: Analyzing traffic sources, user demographics, and page views helps marketers grasp who visits their website, where they’re from, and how they engage with the content. This insight guides content and marketing strategies for specific audience segments.
- Identifying areas for improvement: Examining bounce and conversion rates per page reveals where the user experience may fall short, causing visitors to leave before completing desired actions. Addressing these issues can enhance usability, navigation, and content relevance, fostering better engagement and conversions.
- Personalizing user experience: Leveraging insights on user demographics and behavior enables marketers to personalize content, offers, and promotions for different visitor segments, boosting engagement and conversions.
- Optimizing marketing campaigns: Pinpointing the most effective traffic sources allows marketers to enhance campaigns by focusing resources on channels that bring in the best website traffic.
-
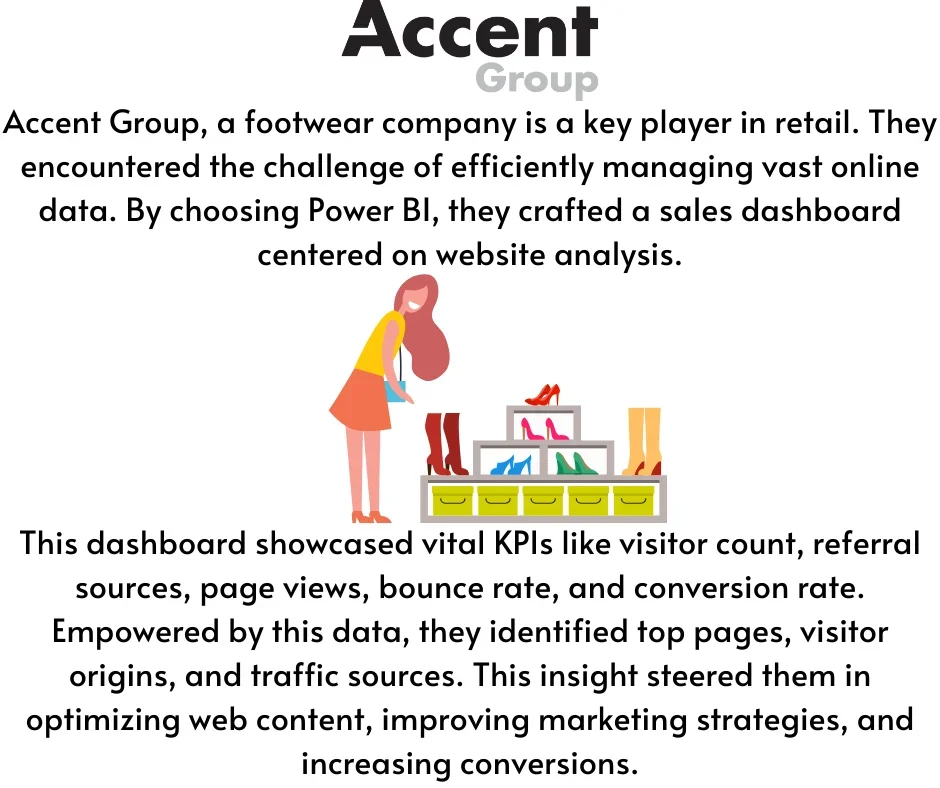
Real Time Success
What is a dashboard in Power BI for market analysis?
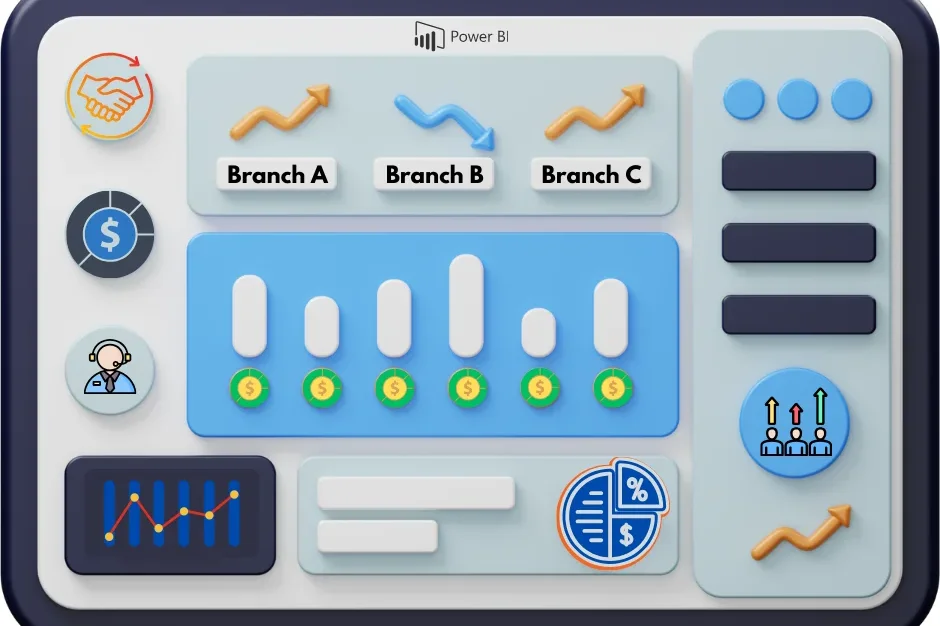
A Power BI digital marketing dashboard for analysis is a robust tool that offers a complete and up-to-the-minute overview of essential market metrics. It’s a one-page display with different visual representations, potentially sourced from one or multiple reports. These dashboards offer an interactive and flexible approach to quickly grasp complex data sets.
For example, sales and marketing dashboards use full potential of Power BI elements to create Key Performance Indicators (KPIs) of your own data that provide important insights. These insights help sales and marketing teams enhance their strategies.
Sales & Customer Insights Dashboard
FunctionsThis Power BI dashboard services present you with a central hub for understanding your customers and their buying habits. It consolidates data from different sources, including:
- Sales transactions Details on purchase history, product categories, amount spent, and purchase frequency.
- Customer demographics: Information on age, location, gender, income level, and occupation (if obtained ethically and in compliance with data privacy regulations).
- Customer loyalty programs: Insights on purchase history, points earned, redemption behavior, and preferred brands/categories.
How To Use This Data?
- Targeted Email Campaigns: Marketers strategically segment customers based on demographics, purchase history, and preferences to tailor personalized emails. These emails not only include product recommendations and special offers but also heartfelt birthday greetings to enhance customer engagement.
- Dynamic Website Content: Websites dynamically adjust content to showcase personalized product recommendations, timely pop-up offers, and relevant information based on a customer’s unique browsing behavior. This customization aims to provide a tailored and engaging online experience for each visitor.
- Data-Driven Promotions: By meticulously analyzing purchase patterns, you can uncover insights into popular products, seasonal trends, and areas with lower sales. Leveraging this valuable data allows you to craft precisely targeted promotions, discounts, and bundled product deals. This strategic approach not only boosts sales but also enhances inventory control efficiency, ensuring optimal stock levels.
- New Product Development: Delve into customer preferences and demographics to gain a deep understanding of various customer segments. Utilize this knowledge to develop innovative products tailored to meet the specific needs of each customer group. By addressing unmet needs through customer-centric product design, you can foster stronger customer relationships and drive product success.
Impact
- Increased Efficiency: Sales and marketing teams can enhance collaboration by using customer insights shared through own data and a central dashboard. This removes the need for manual data analysis and report generation, allowing teams to focus on strategic initiatives and innovative approaches.
- Improved Customer Experience:Personalizing marketing messages and tailoring promotions for specific customer segments enhances the overall customer journey. By offering more relevant experiences, businesses can build brand loyalty and satisfaction, fostering long-term customer relationships and advocacy.
- Data-Driven Decision Making: Adopting data-driven sales and marketing strategies ensures decisions are based on solid data and valuable customer insights. This method replaces intuition or guesswork, leading to more precise decision-making and better campaign performance with targeted strategies.
Real Time Success
Learn How A Manufacturer Enhanced Strategy Making with Power BI
Dashboard Visualization To Assess Sales And Finance Teams’ Goals
Why is Microsoft Power BI a cost-effective solution to improve retail operations?
Power BI is a potent tool that plays a vital role in cutting operating costs for businesses. By analyzing various cost factors, it helps companies identify areas to reduce costs, boosting profitability.
The Power BI dashboard targets top management, providing real-time alerts such as low stock levels. This allows quick decisions and proactive actions to prevent losses, ensuring operational efficiency and financial stability.
For example: Schuh, a top UK footwear retailer, tackled inventory issues and demand forecasting inaccuracies with Microsoft Power BI consulting services. By implementing Power BI, they combined data sources, understood customer behavior, and improved demand forecasts which helped business needs. The result? A 20% reduction in inventory holding costs.
Further, even manufacturers are relying upon Power BI dashboard development. AMOT improved thier real-time monitoring of revenue, inventory & backlog data with Power BI. Our Power BI Experts developed an simple solution which accelerated thier business decisions with real-time insights. Read Now.
Social Media Analytics Power BI Dashboard
The Social Media Analytics Power BI Dashboards is a tailor made central hub via various data sources for overseeing and managing your brand’s online presence across various social media platforms. It not only gathers data but also carefully analyzes crucial metrics, providing insights into how your target audience interacts with your content. Let’s explore the dashboard’s features in detail and see how it empowers marketing teams to make informed decisions for business needs:
Key Metrics Tracked:
- Reach:This metric shows the number of unique users exposed to your content, indicating its visibility.
- Engagement: This metric covers various user interactions like likes, comments, shares, clicks, and other engagements with your posts. It gives a clear picture of how your audience engages with your content.
- Follower Demographics: This feature offers detailed data on your followers’ demographics, including age, location, gender, and interests. Understanding your audience can help tailor content to resonate better with them.
- Sentiment Analysis: This tool assesses sentiment in user comments, mentions, and reviews, categorizing them as positive, negative, or neutral. By analyzing sentiment, you can gain insights into how your audience perceives your brand and content.
Impact
- Platform Comparison: By analyzing metrics such as reach, engagement rates, and demographic data across different social media platforms, marketers can identify the most meaningful insights and channel for connecting with their target audience. This thorough comparison enables them to optimize their strategies and focus on platforms that yield the best results in terms of audience engagement and brand visibility.
- Content Performance: Delving into engagement metrics, including likes, comments, and shares, Microsoft Power BI provides valuable insights into the types of content that resonate most with the audience. Understanding which topics, formats, and styles perform well guides marketers in crafting future content that aligns closely with audience preferences and interests, ultimately enhancing engagement and driving brand loyalty.
Real Time Success
What does a Power BI expert do?
The main role of a Power BI is to use their expertise to craft interactive and user-friendly dashboards and reports. They are responsible for creating, deploying, and tailoring and seamless integration of these reports to fit requirements of your organization during Microsoft Power BI dashboard development.
These experts oversee Power BI development services and manage business intelligence tools like Power BI desktop and app. They are in charge of making strategic decisions and handling technical tasks in software development.
Conclusion
In conclusion, Power BI marketing dashboards truly revolutionize the retail industry. They present a sophisticated yet user-friendly data analysis approach, empowering businesses to extract valuable insights, make informed decisions, and enhance their performance effectively. Tailored to individual requirements, these dashboards offer a comprehensive overview of marketing strategies, enabling businesses to decode customer behavior, monitor sales trends, and pinpoint growth possibilities.
With our steadfast dedication to exceptional customer service and proficiency in delivering top-notch, personalized software solutions, rest assured that you can harness the full potential of Power BI consulting service. Trust us when we say, this is more than a technological investment – it’s an investment in your company’s future.
Consult with our Power BI Experts and embrace the realm of data-driven decision-making, and observe your retail enterprise flourish like never before. Contact Us Today.
Drive Success with Our Tech Expertise
Unlock the potential of your business with our range of tech solutions. From RPA to data analytics and AI/ML services, we offer tailored expertise to drive success. Explore innovation, optimize efficiency, and shape the future of your business. Connect with us today and take the first step towards transformative growth.
You might also like
Stay ahead in tech with Sunflower Lab’s curated blogs, sorted by technology type. From AI to Digital Products, explore cutting-edge developments in our insightful, categorized collection. Dive in and stay informed about the ever-evolving digital landscape with Sunflower Lab.