Whether you belong to the manufacturing industry, healthcare industry, or e-commerce, data plays a prime role and determines the heart of your business. They tell the story of your business starting from the peaceful day-to-day work to the big climax of success and failure. However, having raw data, although crucial, doesn’t tell the whole story. It’s the interpretation that transforms figures into actionable insights and here’s where Power BI emerges as the helping hand and shines the spotlight on the key performance indicators (KPIs).
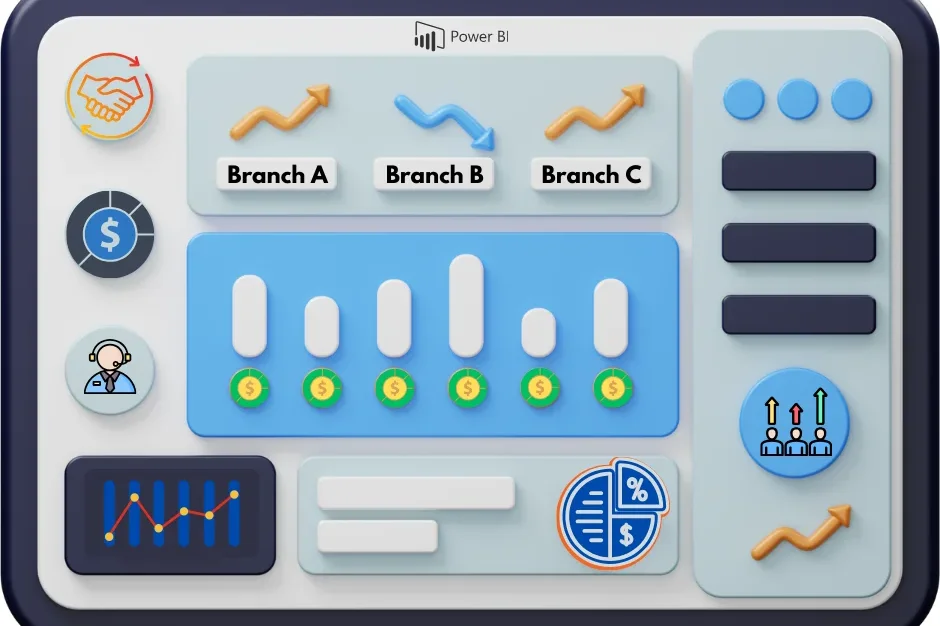
Microsoft Power BI services offer a premier business intelligence tool that authorizes businesses to transform raw data into valuable insights through visually stunning Power BI KPI dashboards. These dashboards not only illuminate the path to success but also reveal hidden opportunities and potential pitfalls along the way. Power BI dashboard development isn’t just pretty reporting of numbers but a graphically delivered strategic information that will help the users be more effective, and efficient and help earn a top spot in the marketplace.
Understanding Power BI KPIs
Before we jump into the details of creating a KPI dashboard in Power BI, a quick revisit of the basics of KPIs and the power they wield is necessary. KPIs, known as key performance indicators, are tangible metrics that are embarked on to measure the effectiveness of organizational objectives in line with the broader strategies of the organization. Be it your job as a sales manager, an administrator of the healthcare industry, or a financial entrepreneur, KPI is a compass that helps you to keep on the right track.
• What Is the KPI Dashboard Used for?
A KPI dashboard Power BI is a critical tool for monitoring and analyzing key performance indicators (KPIs) that are essential for achieving organizational goals and objectives. Among different types of Power BI dashboards, the Power BI KPI dashboard provides a visual representation of key metrics, allowing stakeholders to quickly assess performance, identify trends, and make data-driven decisions. In sales and marketing, it can be used to track lead generation, conversion rates, and revenue targets, helping teams identify areas for improvement and capitalize on successful strategies. In manufacturing, the dashboard can monitor production efficiency, downtime, and quality metrics, enabling managers to optimize processes and reduce costs.
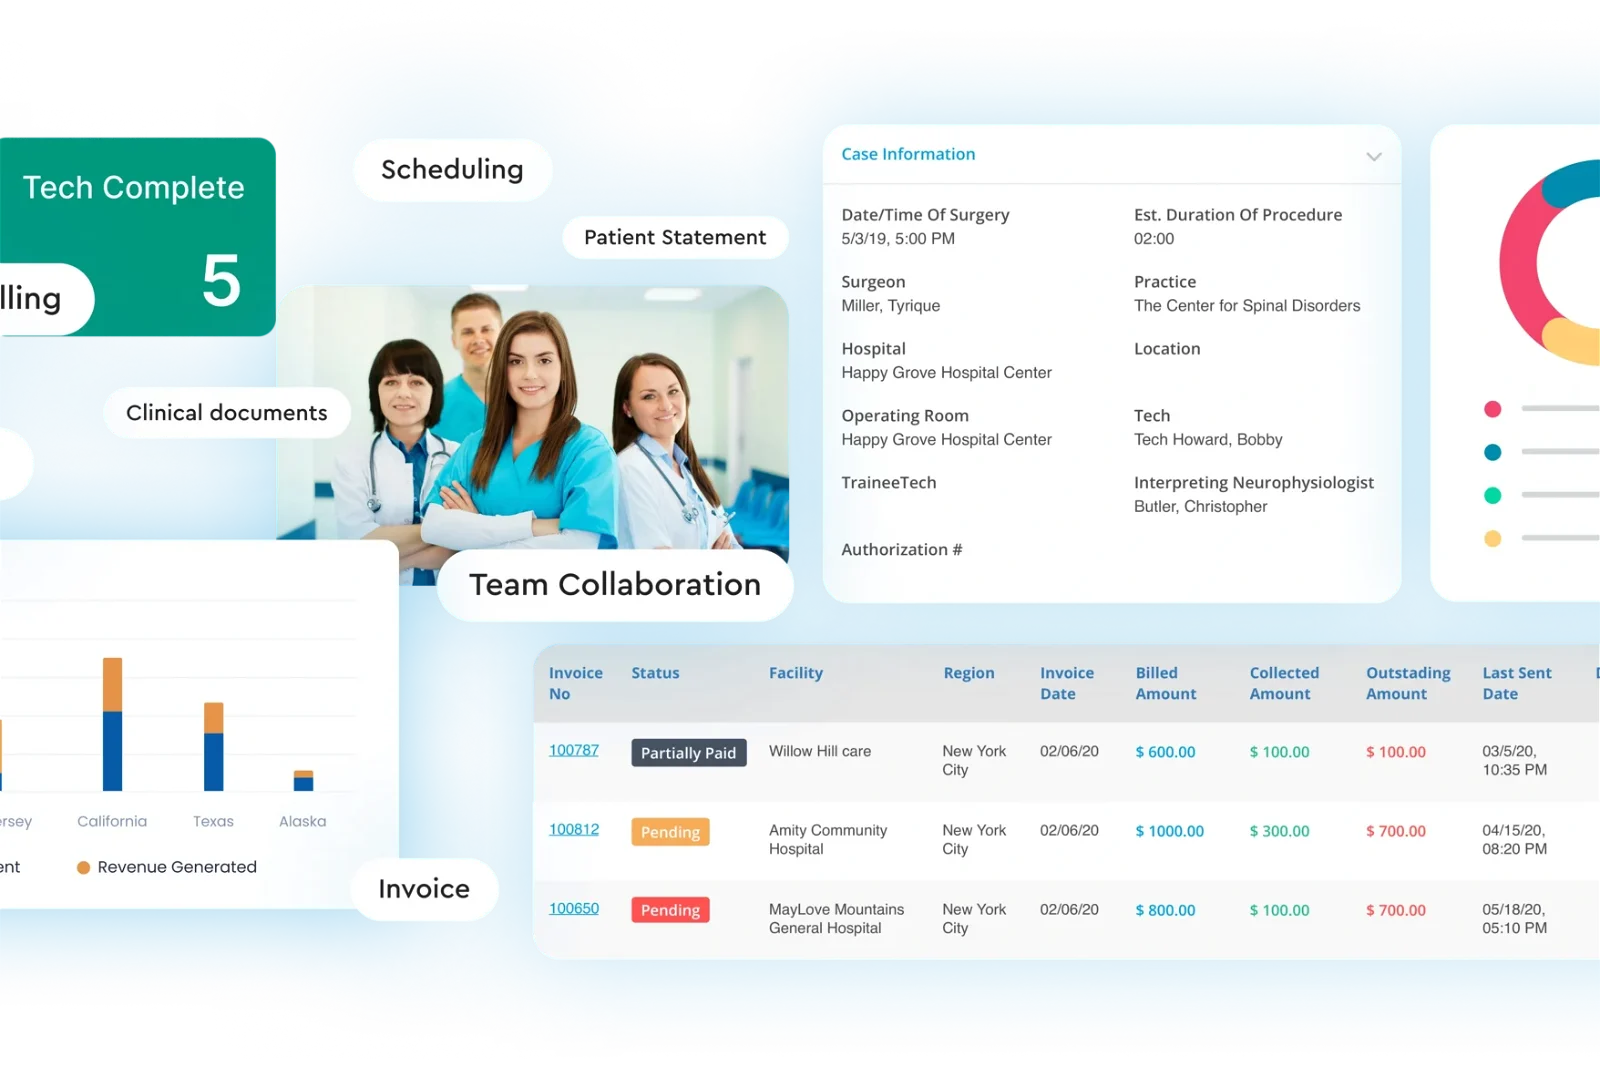
For healthcare providers, a KPI Power BI dashboard can track patient outcomes, wait times, and resource utilization, facilitating better decision-making and improved patient care. In the financial sector, it can monitor key financial indicators such as return on investment (ROI), profit margins, and cash flow, aiding in financial planning and risk management. Overall, a well-optional KPI dashboard could be a powerful tool for analyzing the quality of performance and making strategic decisions in any industry.
• Requirements for KPI visualizations
Several key requirements must be met for the effective visualization of KPIs in Power BI. Firstly, a reliable and well-structured data source is essential. This could be a database, an Excel spreadsheet, or a cloud-based data storage solution.
Secondly, a solid data model is crucial for accurate KPI visualization. This includes defining relationships between different data sets and ensuring the data is clean and consistent. Lastly, calculations are often necessary to derive KPI values from raw data. This could involve simple arithmetic or more complex formulas, depending on the nature of the KPI.
• Power BI's Role in KPI Visualization
Power Bi Dashboard Development Services offers a range of powerful features that make visualizing KPIs a breeze. Its intuitive interface allows users to connect to various data sources and create dynamic, interactive visuals with just a few clicks. The role of dashboards as a self-service business intelligence tool is that they help merge and analyze data, construct visually appealing reports, and create dashboards or advocates of data.
Power BI’s visualization options are extensive, including bar charts, line graphs, pie charts, and more. This flexibility allows users to choose the most appropriate visualizations for their KPIs, ensuring they are easy to understand and interpret.
How Do you Track KPI in Power BI?
Tracking Key Performance Indicators (KPIs) in Power BI is a dynamic process that involves several key steps to ensure accurate and meaningful insights. Here’s a detailed look at how you can effectively track KPIs using Power BI development services:
- Define KPIs: The first step in tracking KPIs is to clearly define them. This involves identifying the specific metrics that are most relevant to your business objectives. For example, if your goal is to improve customer satisfaction, you might track KPIs such as Net Promoter Score (NPS) or Customer Satisfaction Score (CSAT). It’s essential to ensure that your KPIs are specific, measurable, achievable, relevant, and time-bound (SMART).
- Choose Visualization: Microsoft Power BI offers a variety of visualization options to present your KPIs effectively. Choose the visualization that best represents your data and makes it easy for stakeholders to understand. For example, you might use a gauge chart to show progress toward a goal or a line chart to track trends over time.
- Create KPI Visuals: Once you’ve defined your KPIs and chosen your visualization, it’s time to create your Power BI KPI visual. Use the “Add KPI” option to define your KPI based on your data model. You can customize your visuals by adding labels, formatting options, and colors to make them more visually appealing and easy to understand.
- Monitor Performance: Regularly monitor your KPI visuals to track performance against your goals. Power BI allows you to set up automatic data refresh schedules, ensuring that your visuals are always up to date. This enables you to quickly identify any areas that may require attention and take corrective action.
- Analyze Trends: Use Power BI’s interactive features to analyze trends in your KPI data. This can help you identify patterns and correlations that may not be immediately apparent. For example, you might use a trend line to see how a particular KPI has changed over time and identify any seasonal trends or anomalies.
- Share Insights: Power BI allows you to share your KPI visuals with stakeholders, enabling them to gain valuable insights into performance. You can publish your visuals to the Power BI service or export them to other formats, such as PowerPoint or PDF for easy sharing.
Best Practices for Power BI KPI Dashboards
It’s crucial to remember that it’s not only the metrics you track that matter but also the methods used to track them. By implementing these essential best practices, a Power BI expert can guarantee that your Key Performance Indicator (KPI) dashboards are effectively guiding your organization toward making informed and strategic business decisions.
• Identifying Trends
Identifying trends is crucial for understanding your business’s performance over time. To do this effectively, ensure your KPIs are clearly defined and aligned with your business objectives. For example, if your objective is to increase sales, you might track metrics like monthly revenue, conversion rates, and average order value. By analyzing these metrics over time, you can identify trends and patterns that can help you make informed decisions and anticipate future developments.
• Aligning KPIs with Business Objectives
Your KPIs should directly relate to your business goals. Each KPI should be measurable, relevant, and time-bound, aligning with a specific objective. For instance, if your goal is to improve customer satisfaction, you might track metrics like Net Promoter Score (NPS), customer retention rate, and customer feedback scores. Aligning your KPIs with your business objectives ensures that your dashboard provides meaningful insights into your business performance and helps you stay focused on your goals.
• Best Approaches for Measuring and Tracking KPIs
When measuring and tracking KPIs, it’s important to establish clear benchmarks and targets. Regularly review and update your KPIs to ensure they remain relevant and aligned with your business goals. Additionally, use Power BI’s capabilities to create interactive reports and dashboards that allow users to drill down into the data for deeper insights. For example, you can use filters and slicers to allow users to explore the data from different perspectives or use bookmarks to save specific views of the data for easy reference.
Powering Healthcare Innovation through Data Insights
Read how our Power BI solutions revolutionize healthcare management, empowering them with deep insights for better patient care.
Successful Implementation of Power BI KPIs
Implementing KPIs via Power BI development services can change the way businesses operate for good, letting them avail themselves of a whole line of dashboards that adequately speak to a business’ operating sides. From production inputs to sales performance, inventory purchasing, and financial accounting, these dashboards provide the necessary insights that are vital for the formulation of a strategic model. Here, let us look at how each dashboard can transform the way people do business, giving a company the edge in this dynamic business world.
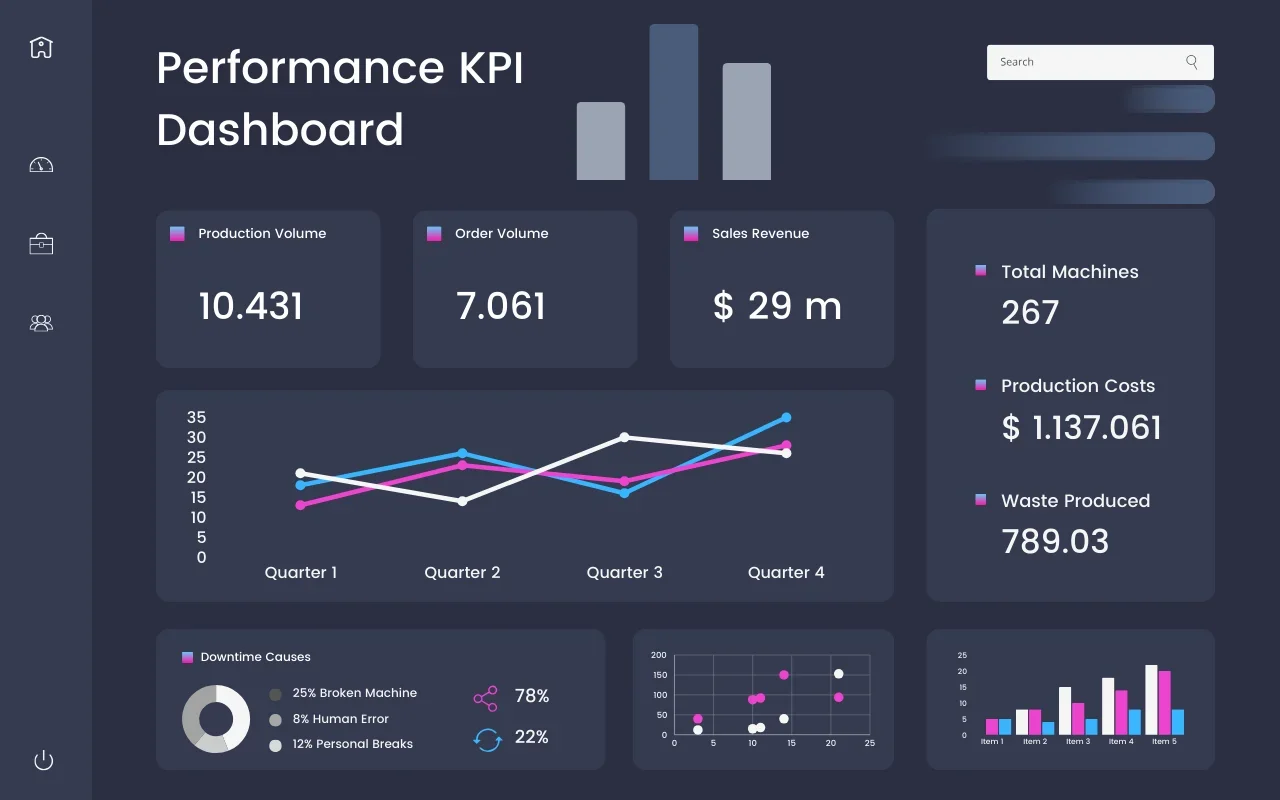
1. Production Insights Dashboard in Power BI
Power BI’s Production Insights Dashboard provides a complete picture of production metrics such as output, efficiency, downtime, and quality. Through the visualization of KPIs, companies can identify backlogs, re-engineer their production processes, and consequently make their businesses considerably more efficient.
Let’s think from the perspective of a manufacturing company. They can use this dashboard to identify a particular machine causing frequent downtime and take corrective action to minimize disruptions. This way, they can know about any persisting issues quickly and measure progress along the way.
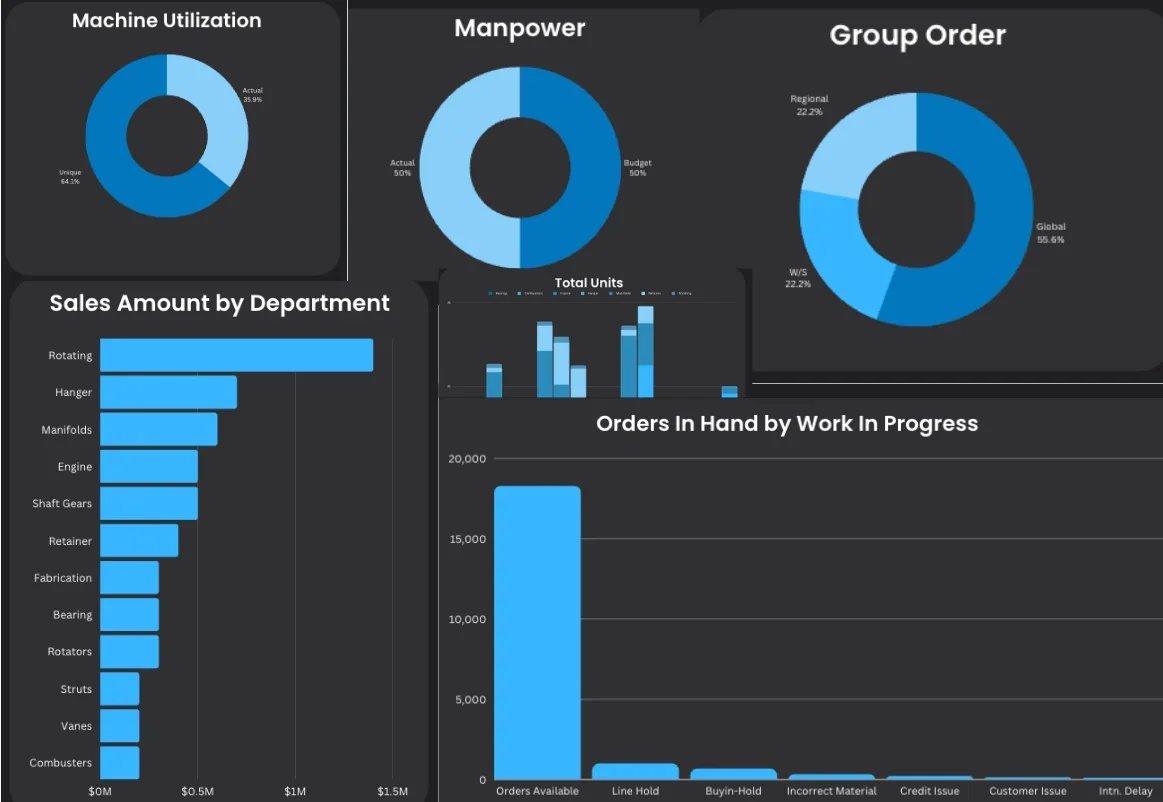
2. Power BI Purchase, Sales, and Inventory Trends Dashboard
This dashboard enables businesses to monitor trends in purchases, sales, and inventory levels over time. By tracking metrics such as inventory turnover rate, sales growth, purchase trends, and stock levels, companies can make informed decisions regarding inventory management, forecasting, and identifying sales opportunities.
For instance, a retail chain can use this dashboard to analyze sales trends across different stores and adjust inventory levels accordingly. This will help the sales managers as well as the sales team to keep a better view of their overall sales performance and identify areas for improvement.
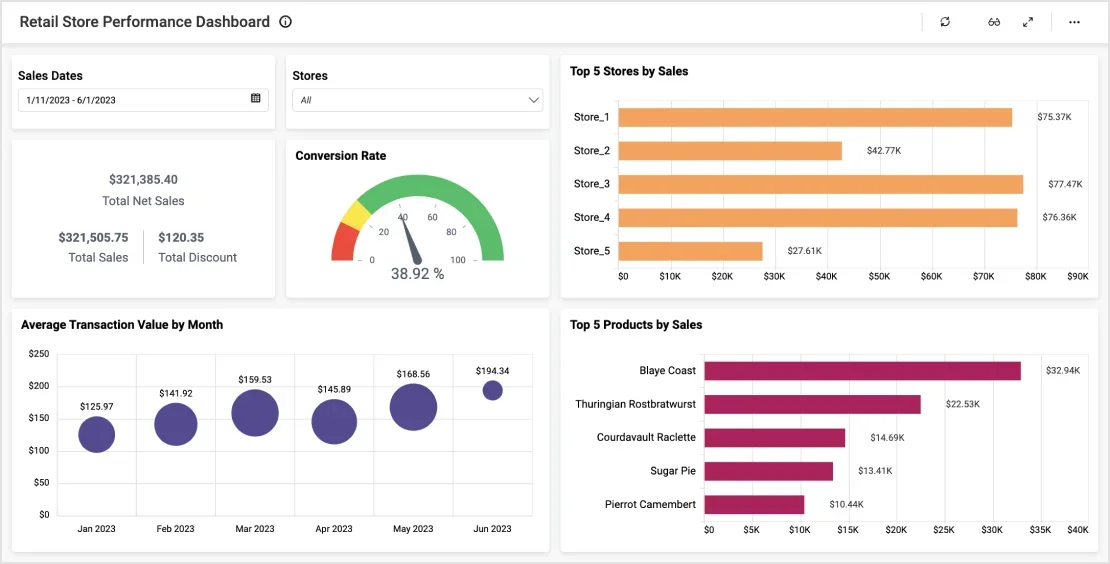
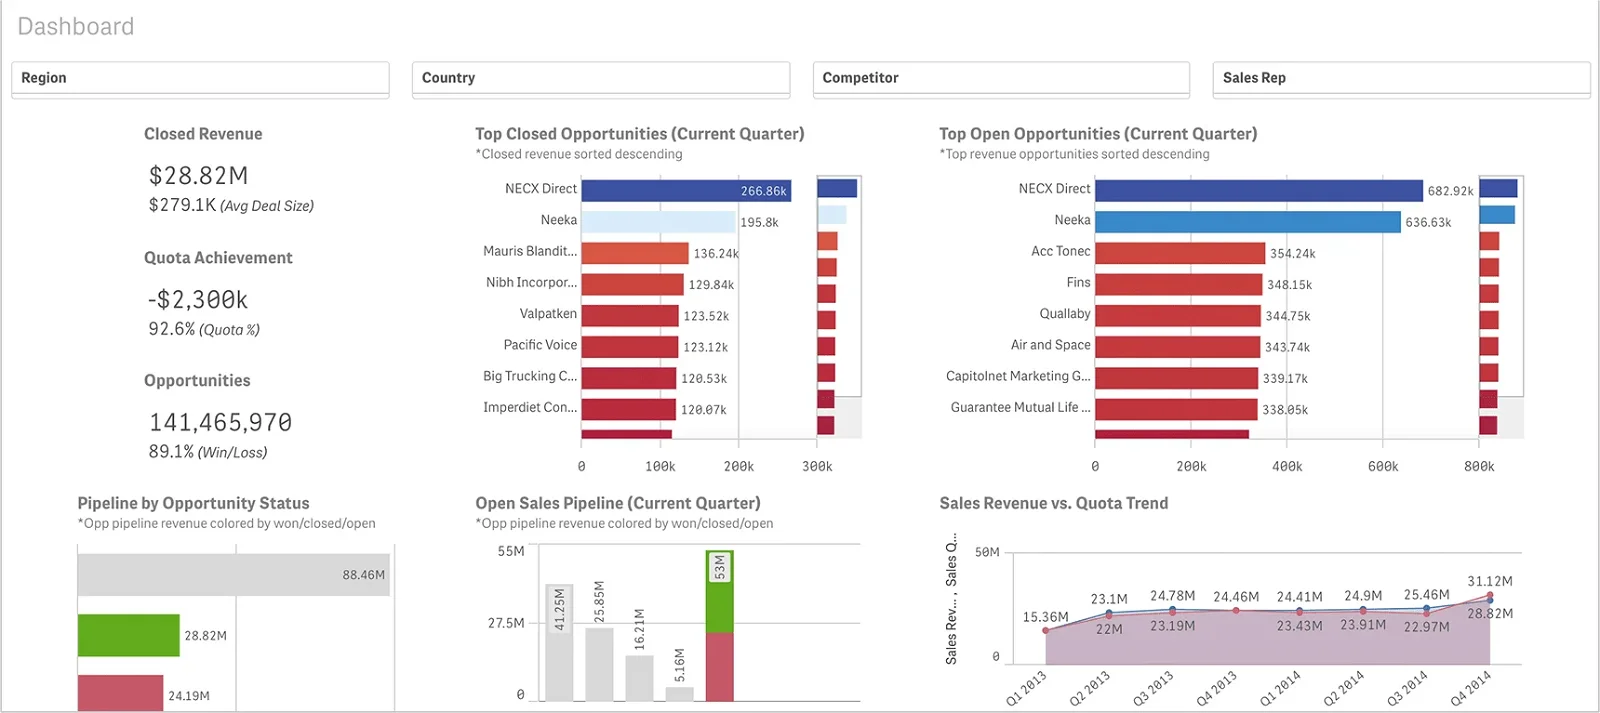
3. Power BI Sales Performance Dashboard
The Sales Performance Dashboard, or sales dashboard, has a wide-angle perspective of sales performance, featuring factors like sales revenue, sales growth, customer acquisition, and sales pipeline It is a tool for recognizing the best-selling products, sales territories, and sales reps. The gathered data, consequently, becomes the basis for decisions aimed at the expansion of sales.
To give an illustration, an e-commerce company might generate a sales dashboard to find out which products sell well, after which they can find out the best marketing strategy and make use of it to capitalize on the trend.
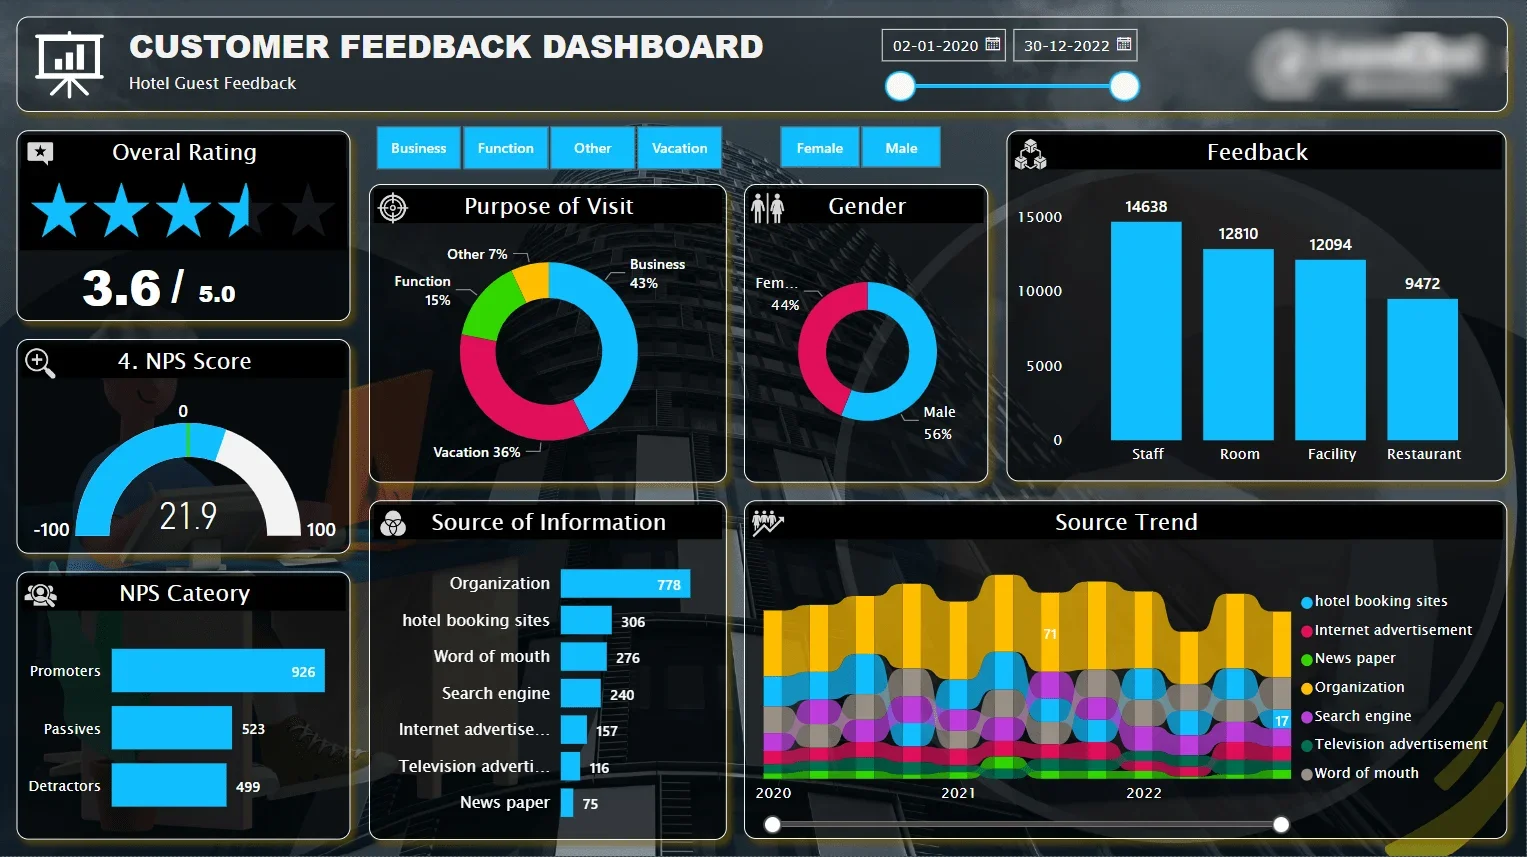
4. Power BI Customer Analysis Dashboard
Knowing the behavior of customers is a critical requirement for a business to remain on the winning side. The Customer Analysis Dashboard in Power BI allows hotels, resorts, and other touristic venues to analyze customer demographics, buying behavior, customer lifetime value, and overall customer satisfaction. This data can show enterprises the best way to position themselves in the market and raise clients’ demand and, thus, sales.
For instance, a luxury hotel chain can utilize Power BI to analyze guest demographics, preferences, and satisfaction scores. By segmenting guests based on spending patterns, loyalty status, and feedback ratings, the hotel can tailor marketing campaigns, room packages, and loyalty rewards to meet individual guest needs.
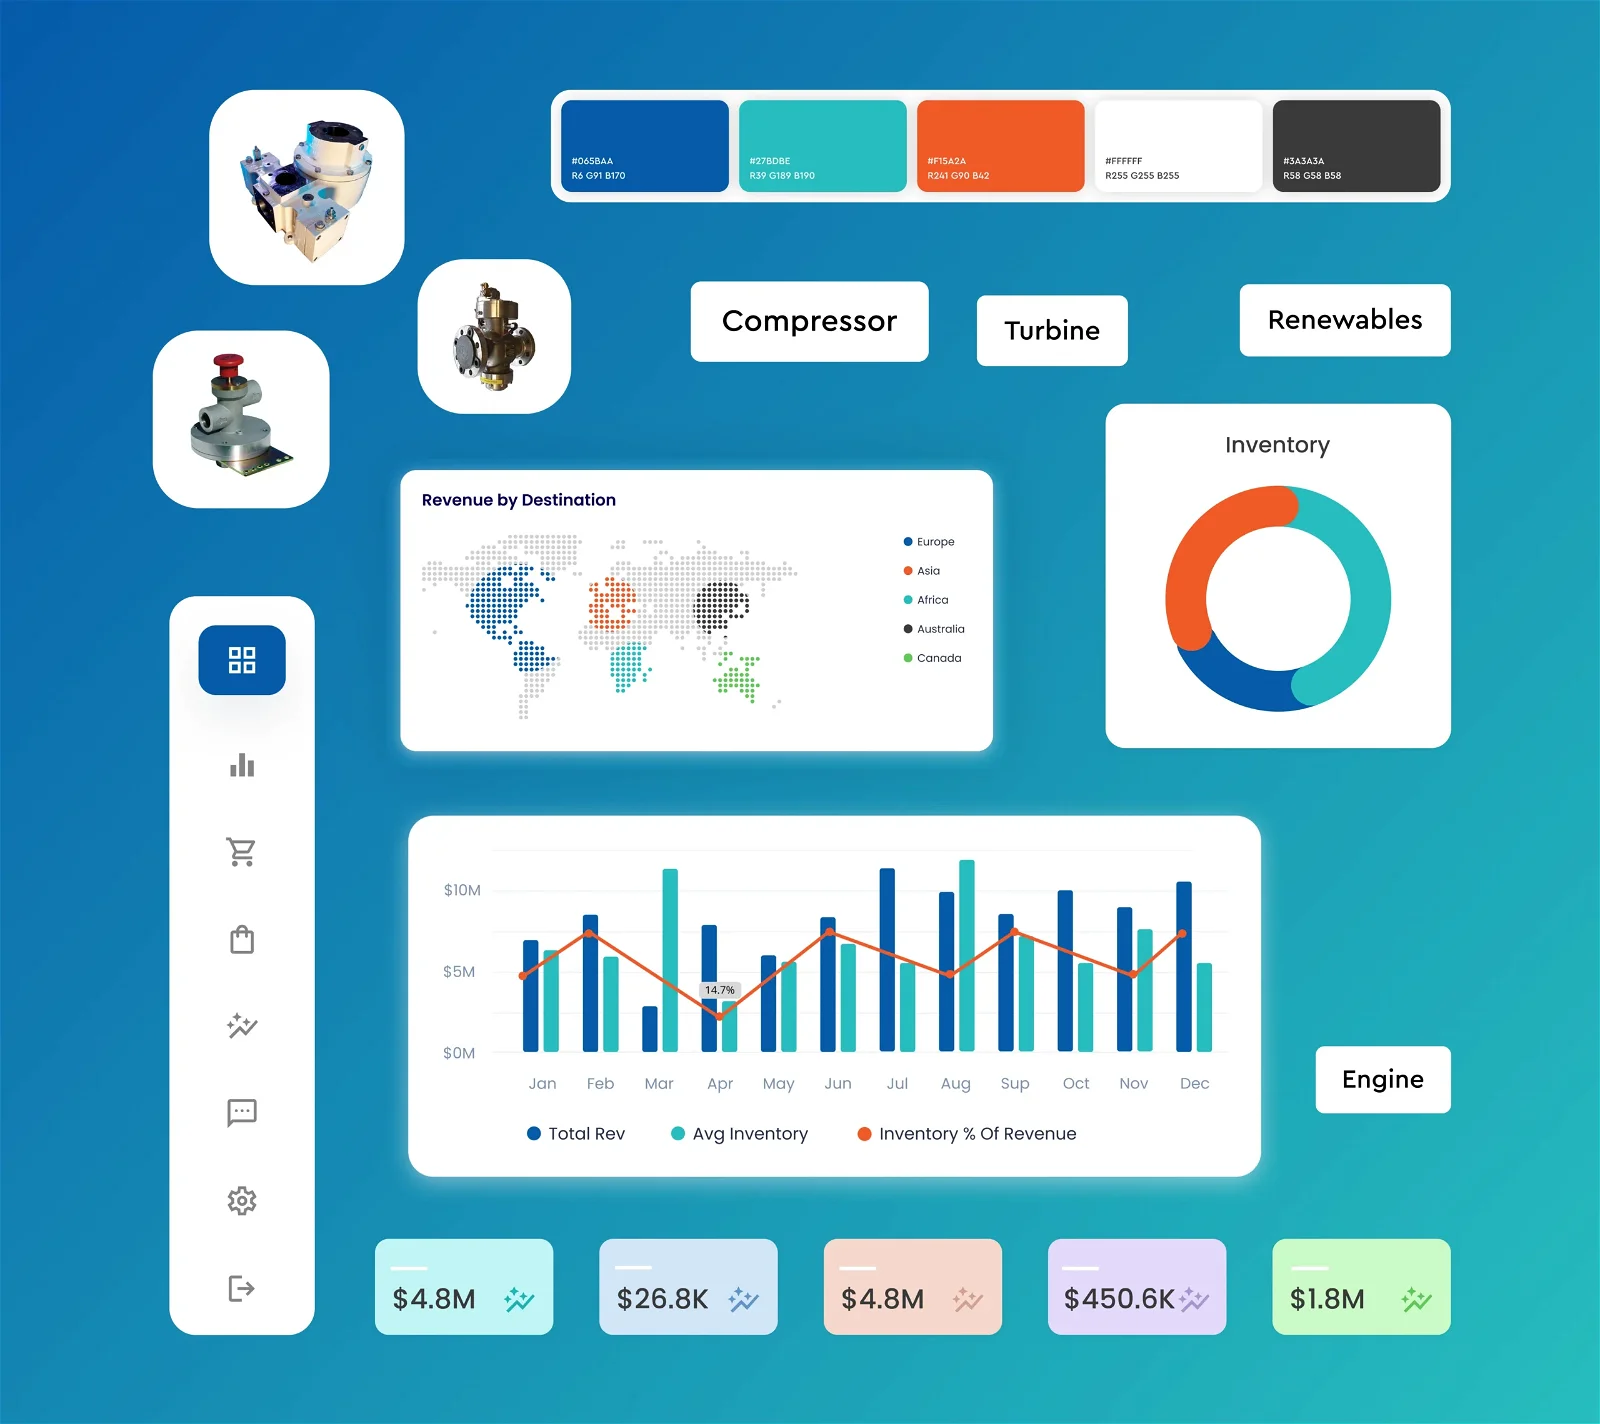
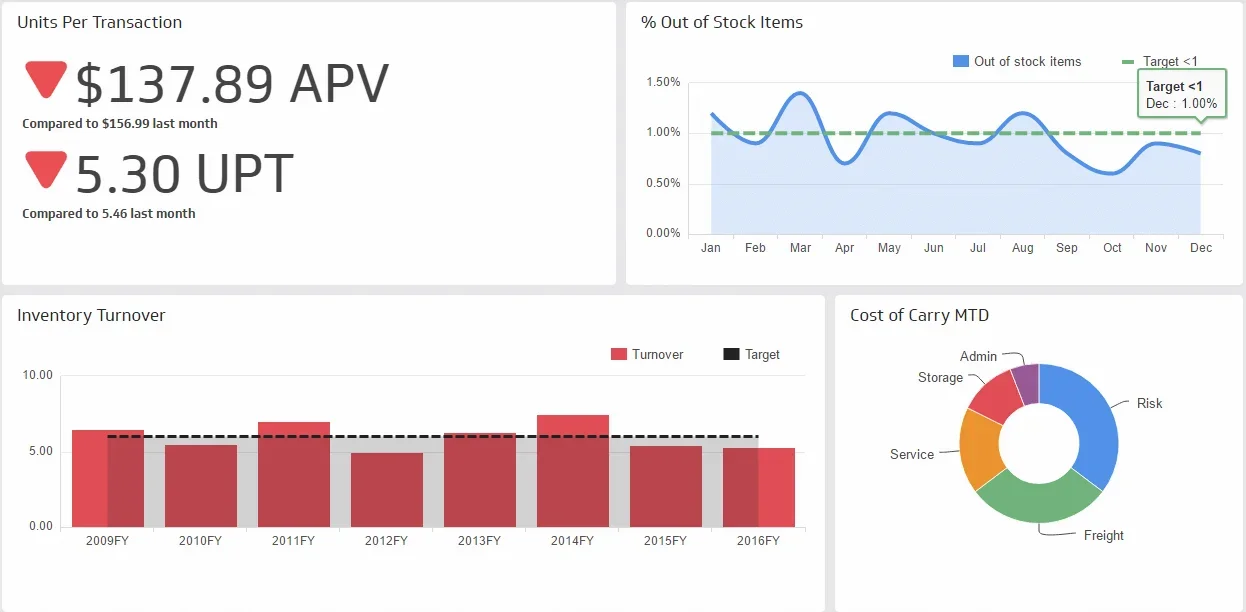
5. Inventory Management Dashboard in Power BI
The Inventory Management Dashboard helps businesses track and manage inventory efficiently. By monitoring metrics such as stock levels, stock turnover, reordering frequency, and inventory costs, companies can optimize inventory levels, reduce stockouts, and improve cash flow. AMOT, a company specializing in industrial valve manufacturing, recognized the importance of real-time inventory and backlog management to prevent operational issues.
Facing challenges in consolidating and accessing data from various sources, they sought a solution to monitor metrics like inventory, backlog, and revenue effectively. Sunflower Lab’s Power BI experts created a dynamic Power BI dashboard that helped AMOT transform raw data into actionable business intelligence.
6. Power BI Product Sales KPI Dashboard
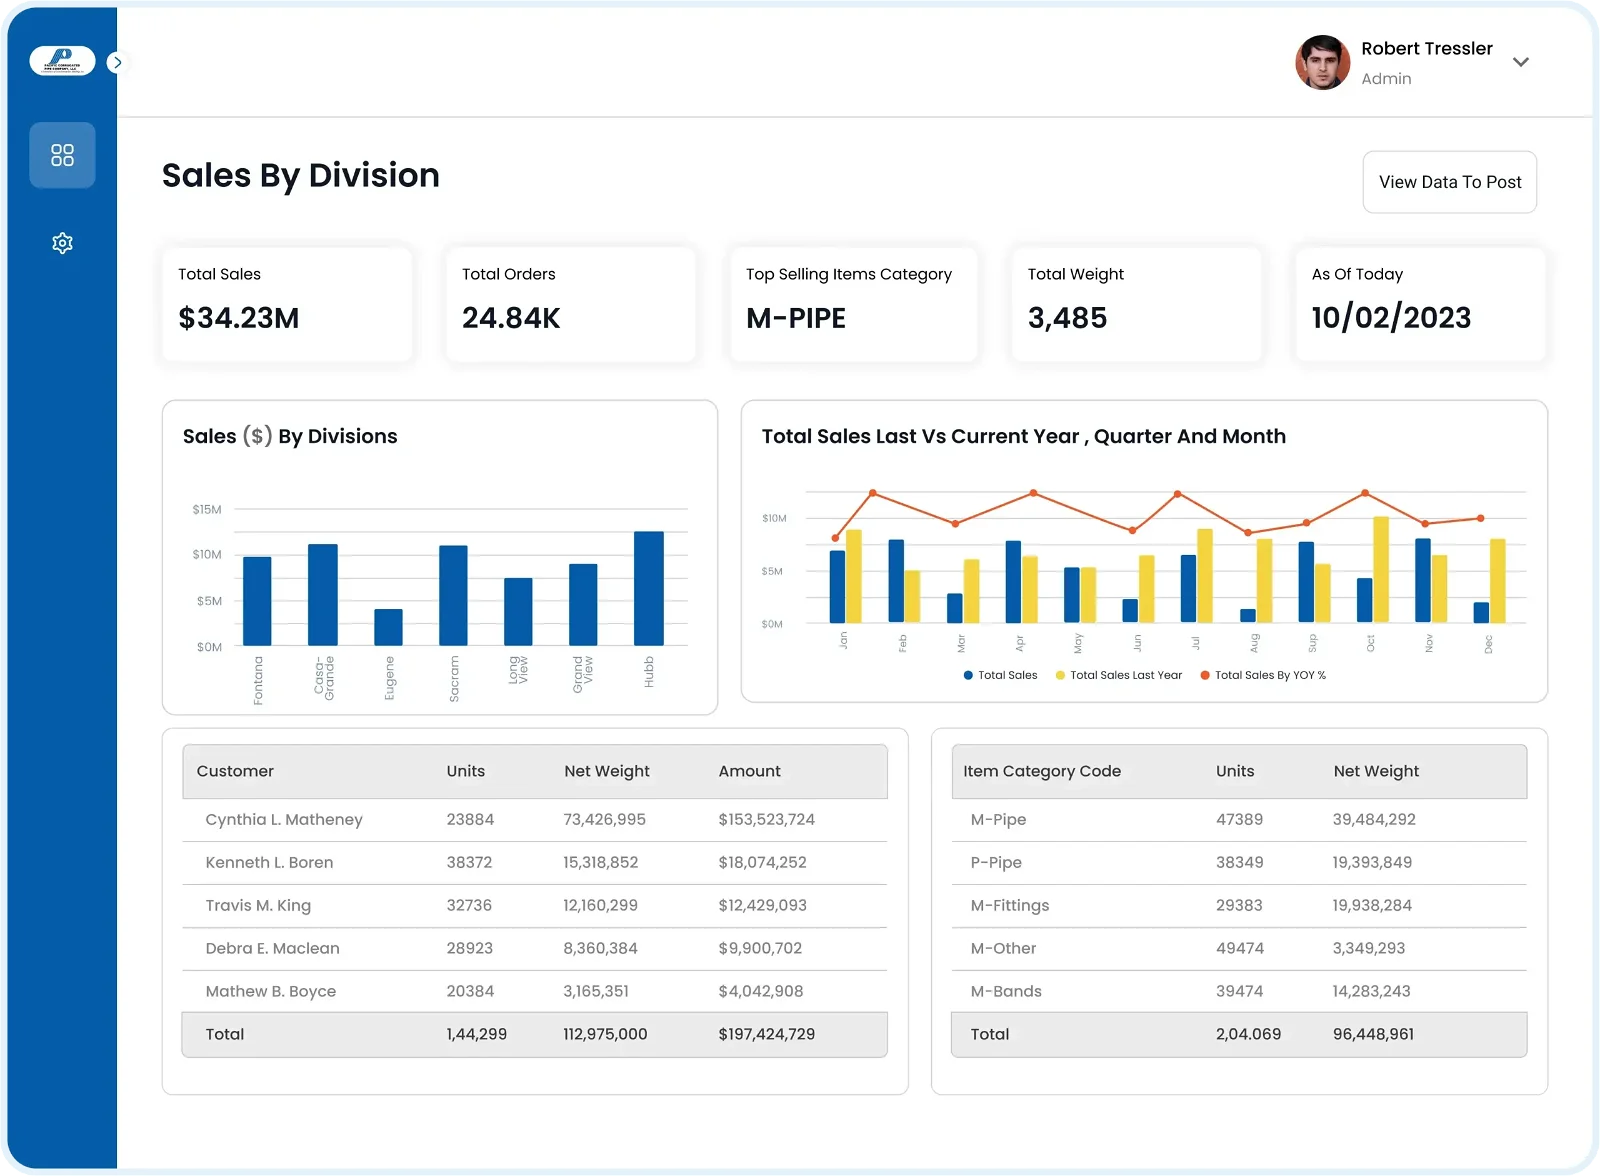
Tracking product sales KPIs is essential for evaluating the performance of products. This dashboard allows businesses to analyze metrics such as product sales revenue, units sold, profit margins, and product returns. It helps identify top-selling products, assess product profitability, and optimize the product portfolio. Pacific Corrugated Pipe Company, headquartered in California, specializes in producing both pre-made and custom pipes, adjusting production based on market demands.
With the visualization of their sales KPI metrics, they streamlined their processes and enhanced divisional performance by gaining insights into total sales, total orders, top-selling item categories, and total weight. This data-driven approach enables the company to make informed decisions and enhance divisional performance.
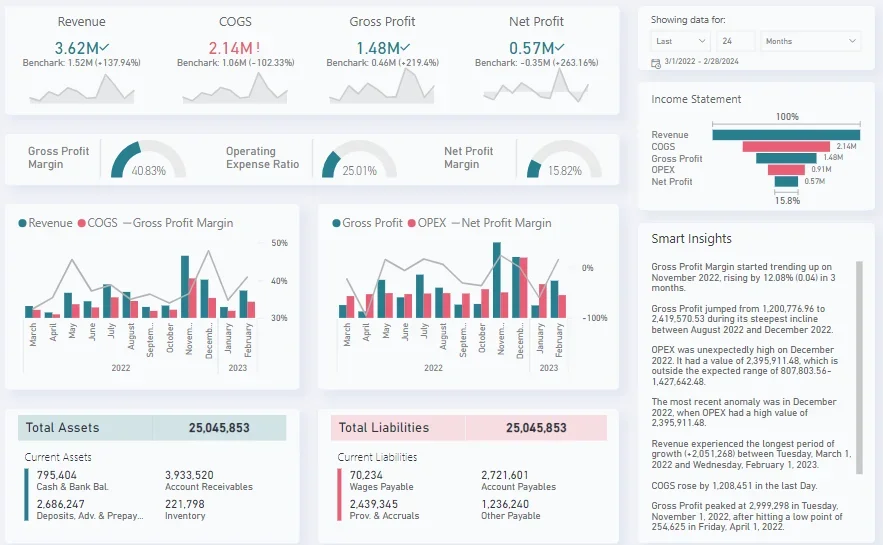
7. Finance and Accounting Power BI Dashboard
The Finance and Accounting Dashboard provides a comprehensive view of financial performance. Businesses can track metrics such as revenue, expenses, profit margins, cash flow, and financial ratios. This dashboard helps monitor financial health, identify cost-saving opportunities, and improve financial planning.
For example, a bank could use this dashboard to analyze revenue streams from various banking products and services, such as loans, deposits, and investments. By identifying profitable products and optimizing pricing strategies, the bank can improve its overall financial health and profitability.
8. Power BI Operations and Supply Chain Dashboard
Efficiently managing operations and the supply chain is critical to business success. This dashboard allows businesses to monitor metrics such as production costs, supply chain efficiency, lead times, and supplier performance. It helps optimize operations, reduce costs, and improve supply chain visibility.
For example, a logistics company specializing in food delivery could use this dashboard to track delivery times and analyze transportation costs. By optimizing route planning and improving supply chain visibility, the company can improve operational efficiency and customer satisfaction.
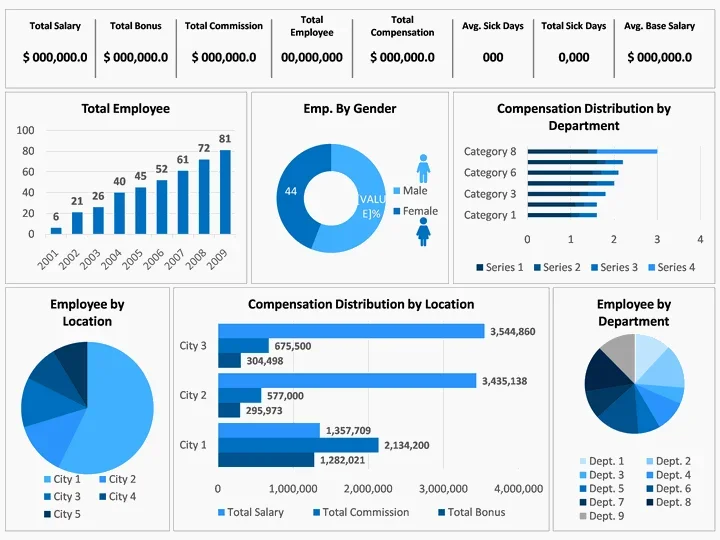
9. Power BI Human Resources Dashboard
The Human Resources Dashboard helps businesses track HR metrics such as employee turnover, recruitment effectiveness, training costs, and employee satisfaction. This dashboard provides insights into the workforce, enabling businesses to improve HR processes, enhance employee engagement, and retain top talent.
For instance, a manufacturing company could use this dashboard to analyze employee turnover rates by department and identify factors contributing to attrition. By implementing targeted training programs and improving workplace policies, the company can retain top talent and enhance overall workforce productivity.
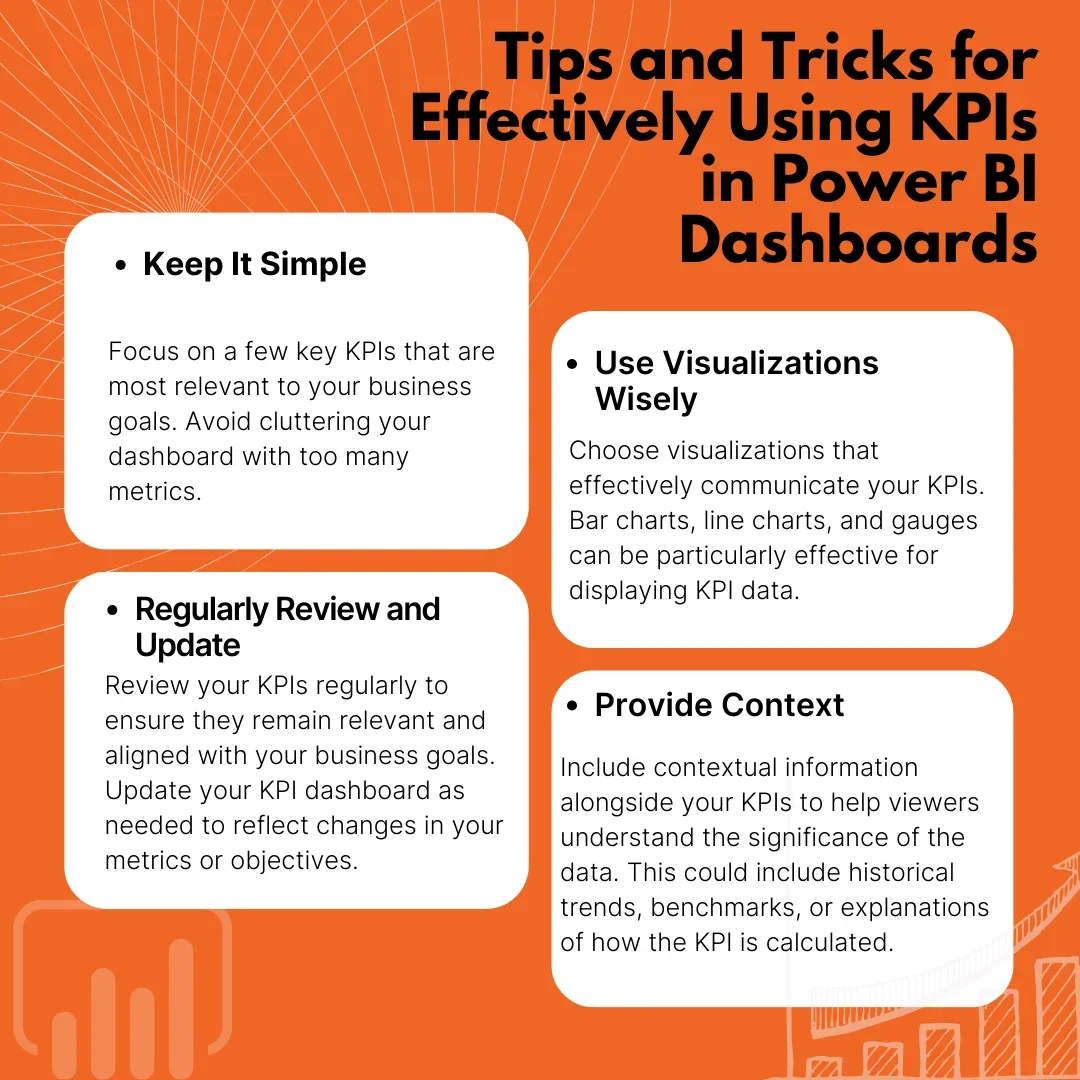
Tips and Tricks for Effectively Using KPIs in Power BI Dashboards
Mastering the KPI Power BI dashboard is key to mastering analytics. Your ability to make data both informative and actionable is crucial in the dynamic field of data visualization. This is why we are providing you with some constructive tips and tricks that will assist you in designing KPI dashboards that focus on visual excellence while providing the precision tools needed for effective decision-making.
Unique Uses and Examples of a Power BI KPI Dashboard
Explore the endless possibilities of Power BI KPI dashboards with these unique and inspiring examples. From analyzing YouTube data to optimizing Formula 1 performance, these dashboards showcase the diverse applications of Power BI development services. These unique examples of Power BI KPI dashboards will definitely inspire and refresh your dashboard design.
• YouTube Data Power BI Dashboard Example
Crafted for content creators, this innovative dashboard is designed to analyze and visualize key metrics for a YouTube channel. From views and likes to comments and subscriber growth, the dashboard offers in-depth insights into audience engagement, popular content, and channel performance. Armed with these insights, channel owners can refine their content strategy, enhance audience engagement, and drive growth for their channel.
• Formula 1 Performance Analysis Power BI Dashboard
Precision-engineered for Formula 1 teams, this cutting-edge dashboard is indispensable for analyzing and optimizing race performance. Featuring critical KPIs such as lap times, pit stop durations, driver standings, and team rankings, the dashboard offers unparalleled insights into race performance, strategy effectiveness, and competitor analysis. With these insights at their disposal, teams can make informed decisions, refine their strategies, and elevate their performance.
• Gaming Analytics Dashboard
Designed for game developers, the Gaming Analytics Dashboard provides a comprehensive overview of player behavior, game performance, and in-game purchases. It allows developers to gain insights into player preferences, analyze level difficulty, and track revenue generation. By leveraging this dashboard, game developers can make informed decisions regarding game design, marketing strategies, and monetization techniques, ultimately enhancing the overall gaming experience for players.
• Food Sustainability Dashboard
The Food Sustainability Dashboard is a powerful tool that tracks the sustainability of food products, focusing on factors such as sourcing practices, carbon footprint, and nutritional value. It enables consumers to make informed choices about the food they purchase, promoting sustainability in the food industry. By using this dashboard, stakeholders can assess the environmental impact of food products, drive sustainable practices, and contribute to a more sustainable future.
• Event Management Dashboard
Tailored for event planners, the Event Management Dashboard provides real-time insights into event metrics such as ticket sales, attendee demographics, and social media engagement. It enables event planners to optimize event planning and marketing strategies, leading to more successful and engaging events. With this dashboard, event planners can make data-driven decisions, improve event experiences, and enhance overall event success rates.
Conclusion
In the era of data, the power of numbers is undoubtedly strong. However, it is the manner in which these statistics are utilized, recounted, and shared that converts them into insights that drive business growth. Creating KPI dashboards in Power BI is the art of transforming data into intelligence; it’s about clarifying the hazy and simplifying the complex in order to provide a picture worth a thousand spreadsheets.
It’s crucial to remember that the value of these dashboards extends beyond their creation. Power BI dashboard development services play a vital role in helping businesses not only build but also refine and continuously optimize their KPI dashboards. These services enable companies to extract valuable insights from their data, uncovering hidden opportunities that may otherwise go unnoticed.
Whether you’re looking to build a new KPI dashboard or enhance an existing one, Sunflower Lab‘s team of Power BI experts is here to help. Contact us today to discover how our Power BI development services can transform your data into intelligence and actionable insights.
You might also like
Stay ahead in tech with Sunflower Lab’s curated blogs, sorted by technology type. From AI to Digital Products, explore cutting-edge developments in our insightful, categorized collection. Dive in and stay informed about the ever-evolving digital landscape with Sunflower Lab.