Understanding the language of data is the key to success in today’s fast-paced business environment. Power BI is a dynamic tool that transforms unprocessed data into meaningful insights to give you a competitive edge by using the full potential of your data.
For decision-makers, it’s like having a help hand that makes complicated data easy to understand dashboards. Consider it your data ally, assisting you in easily navigating the huge ocean of information.
Today, we are not going to get you tangled up in technical jargon, instead, our focus is to make everyone understand the different types of Power BI Dashboard in the easiest way possible. Whether you’re in finance, marketing, healthcare, or HR, Power BI is here to enhance your data management and supercharge your analysis skills.
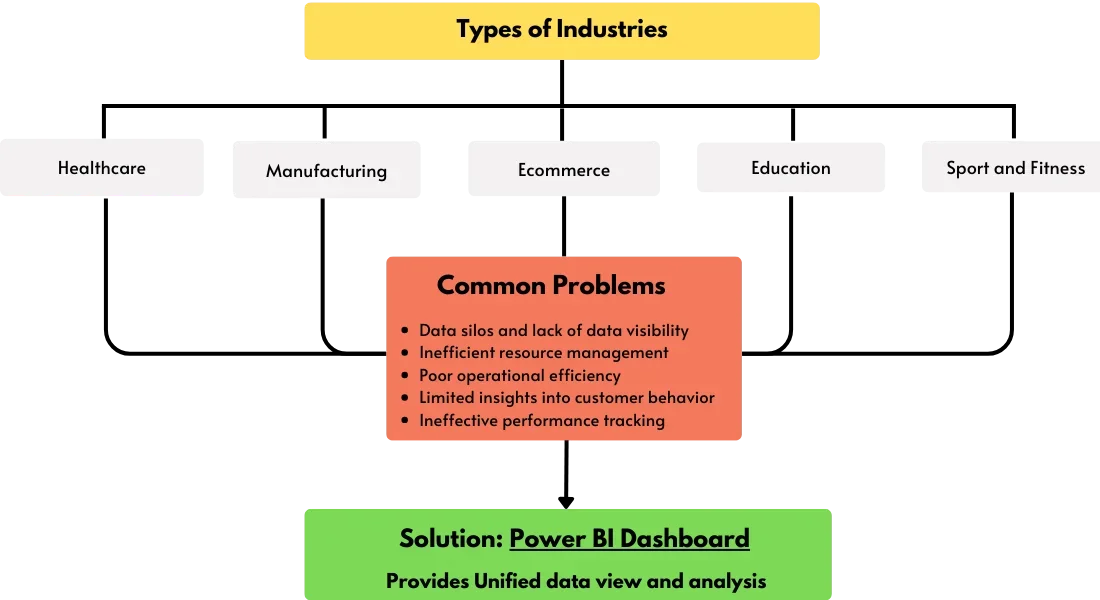
Common Challenges Businesses Face in Managing and Analyzing Data
Power BI has so much potential to address several questions across different industries. While some industries already know its potential, others are still deprived of it. By knowing the impact of the Power BI dashboard in different industries, people will become more aware of how they can transform their business.
1. Enhancing Data Visibility and Accessibility
Power BI Dashboards serve as a centralized hub, providing a clear view of critical data points from various sources. This enhances visibility and accessibility, enabling quick access to essential information.
2. Improving Analytical Capabilities
By consolidating data into visually appealing and comprehensible formats, Power Bl Dashboards enhance analytical capabilities, allowing users to extract meaningful insights without the need for complex data analysis.
3. Facilitating Informed Decision-Making Processes
Informed decisions are the backbone of successful businesses. Power Bl Dashboards empower executives by presenting data in a digestible manner, facilitating quicker and more precise decision-making.
Benefits of Utilizing Power BI Dashboards
With the ability to deal with a diverse data set that comes from multiple sources, companies may make decisions that have a lasting impact and perhaps lead to enhanced profitability. Managing this abundance of data completely may be difficult, making Microsoft Power BI dashboards a useful tool.
1. Boost Efficiency Across the Organization
- Power BI dashboards streamline data processes, reducing the time spent on data collection and analysis.
- This efficiency boost translates into improved overall organizational performance.
2. Establish Data-Informed Decision-Making
- Integrating Power BI dashboards into the workflow promotes a culture of data-driven decision-making.
- Ensure that every choice is based on accurate and up-to-date information.
3. Align Teams and Goals Effectively
- The collaborative nature of Power BI dashboards facilitates better alignment of teams and goals.
- Ensuring everyone is on the same page and working towards shared objectives.
4. Democratize Data Access Across the Organization
- Power BI dashboards break down data silos, democratizing access to information across the organization.
- Ensuring that all stakeholders can contribute to and benefit from data-driven insights.
5. Enhance Stakeholder Communication
- Power BI dashboards provide a visual and intuitive way to communicate complex data.
- Making it easier to convey information to stakeholders at all levels.
6. Continuous Improvement Through Data-Driven Iteration
- Power BI dashboards support a cycle of continuous improvement by providing real-time feedback on key performance indicators.
- Enabling organizations to adapt and refine strategies dynamically.
Power Up Your Business Intelligence with Power BI
Turn complexity into clarity with our user-friendly Power BI solutions.
How Power BI Navigates Diverse Business Challenges
Power BI excels at navigating a wide range of business difficulties. Find out how Power BI easily addresses these problems for increased company efficiency, from inventory complexity to financial barriers.
- Financial Challenges: Power BI financial dashboard provides a comprehensive overview, aiding in budgeting, forecasting, and financial analysis.
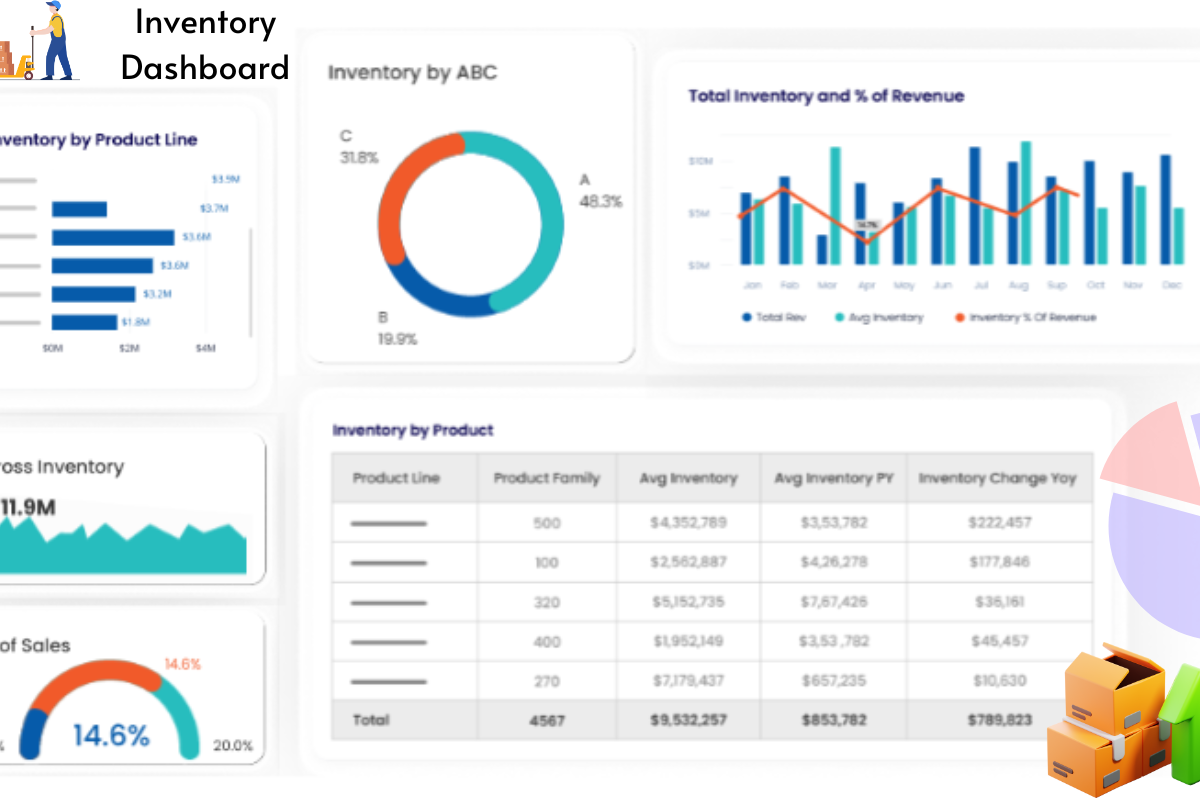
- Inventory Management: Power BI’s inventory dashboards offer real-time visibility into stock levels, demand forecasting, and supply chain optimization.
- Sales and Marketing: Tailored sales and marketing Power BI dashboard empower businesses with insights into customer behavior, sales trends, and campaign effectiveness.
- HR Analytics: Power BI’s HR dashboards streamline human resource processes, from talent acquisition to employee performance analysis.
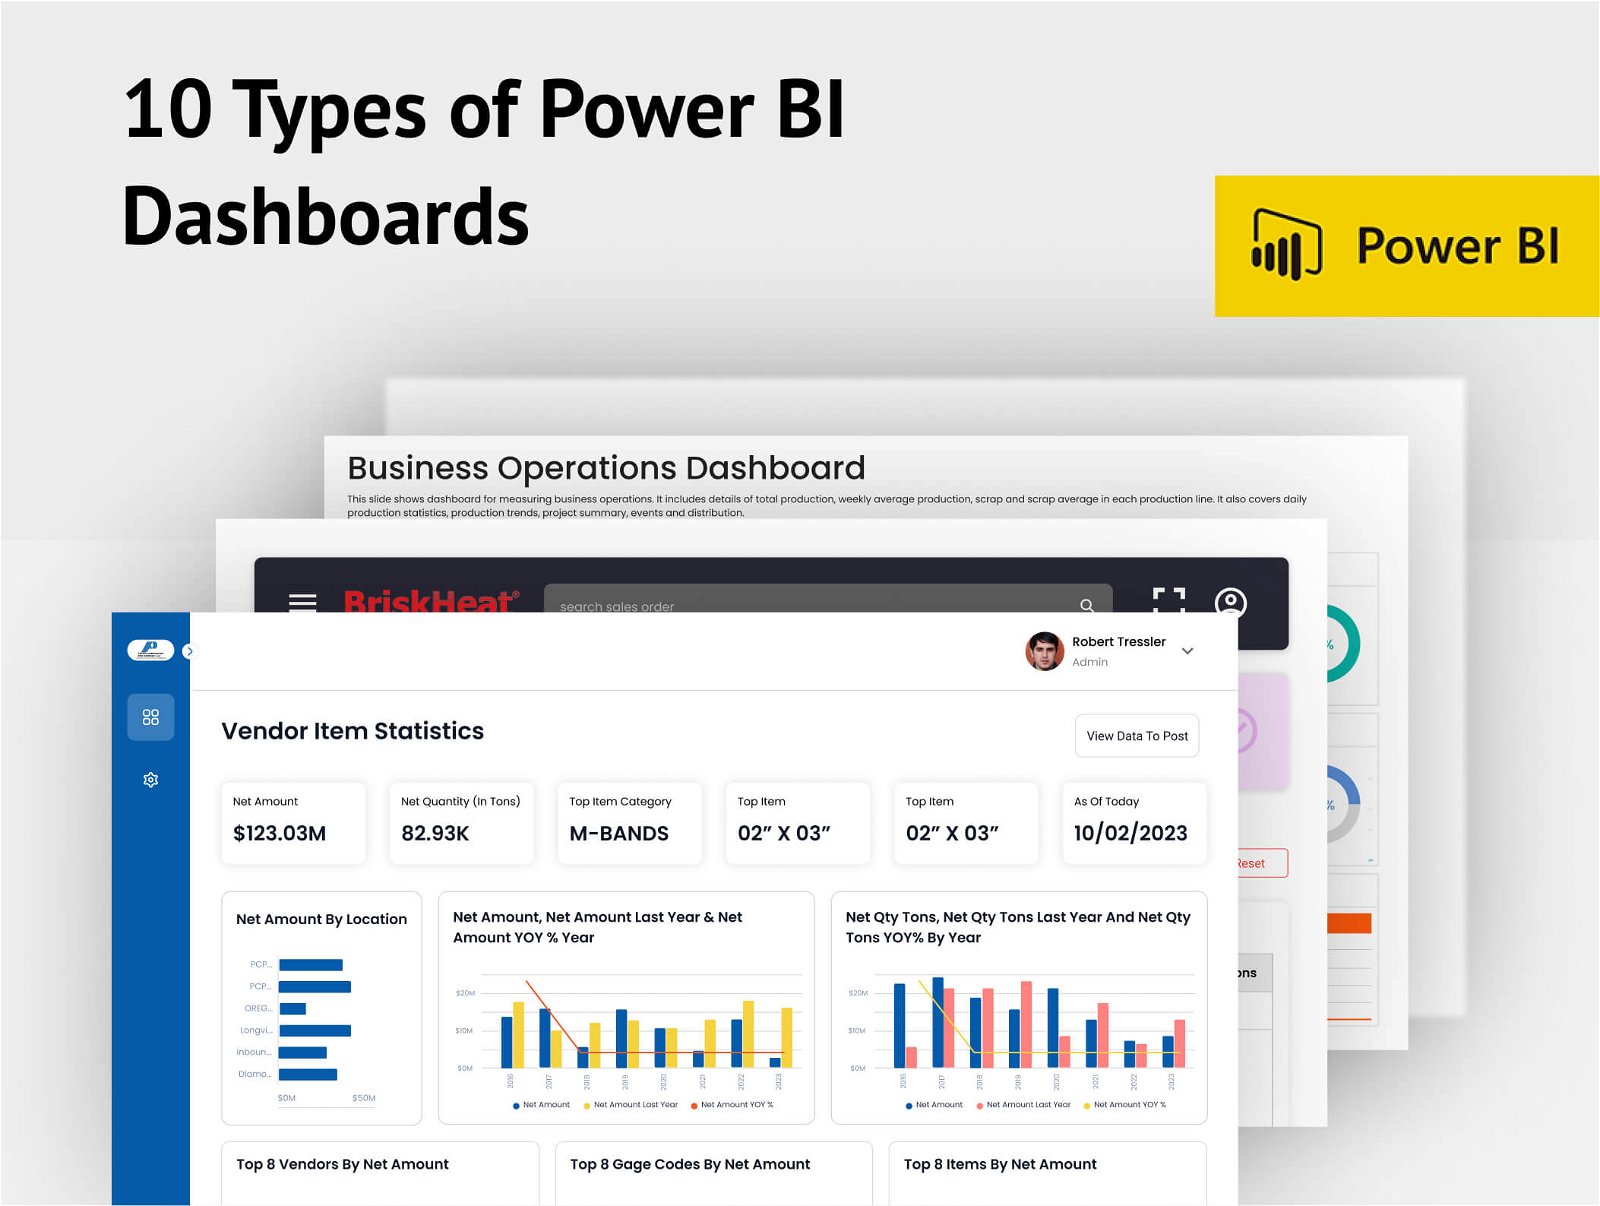
Types of Power BI Dashboards
An interactive report dashboard is crafted to present a rich collection of interactive visualizations and reports. Users can flawlessly explore data by interacting with visuals, applying filters, and drilling down into details. These dashboard types are ideal for offering a comprehensive view of data with the added advantage of real-time analysis.
1. Interactive Report Dashboard
An interactive report dashboard is crafted to present a rich collection of interactive visualizations and reports. Users can flawlessly explore data by interacting with visuals, applying filters, and drilling down into details. This dashboard type is ideal for offering a comprehensive view of data with the added advantage of real-time analysis.
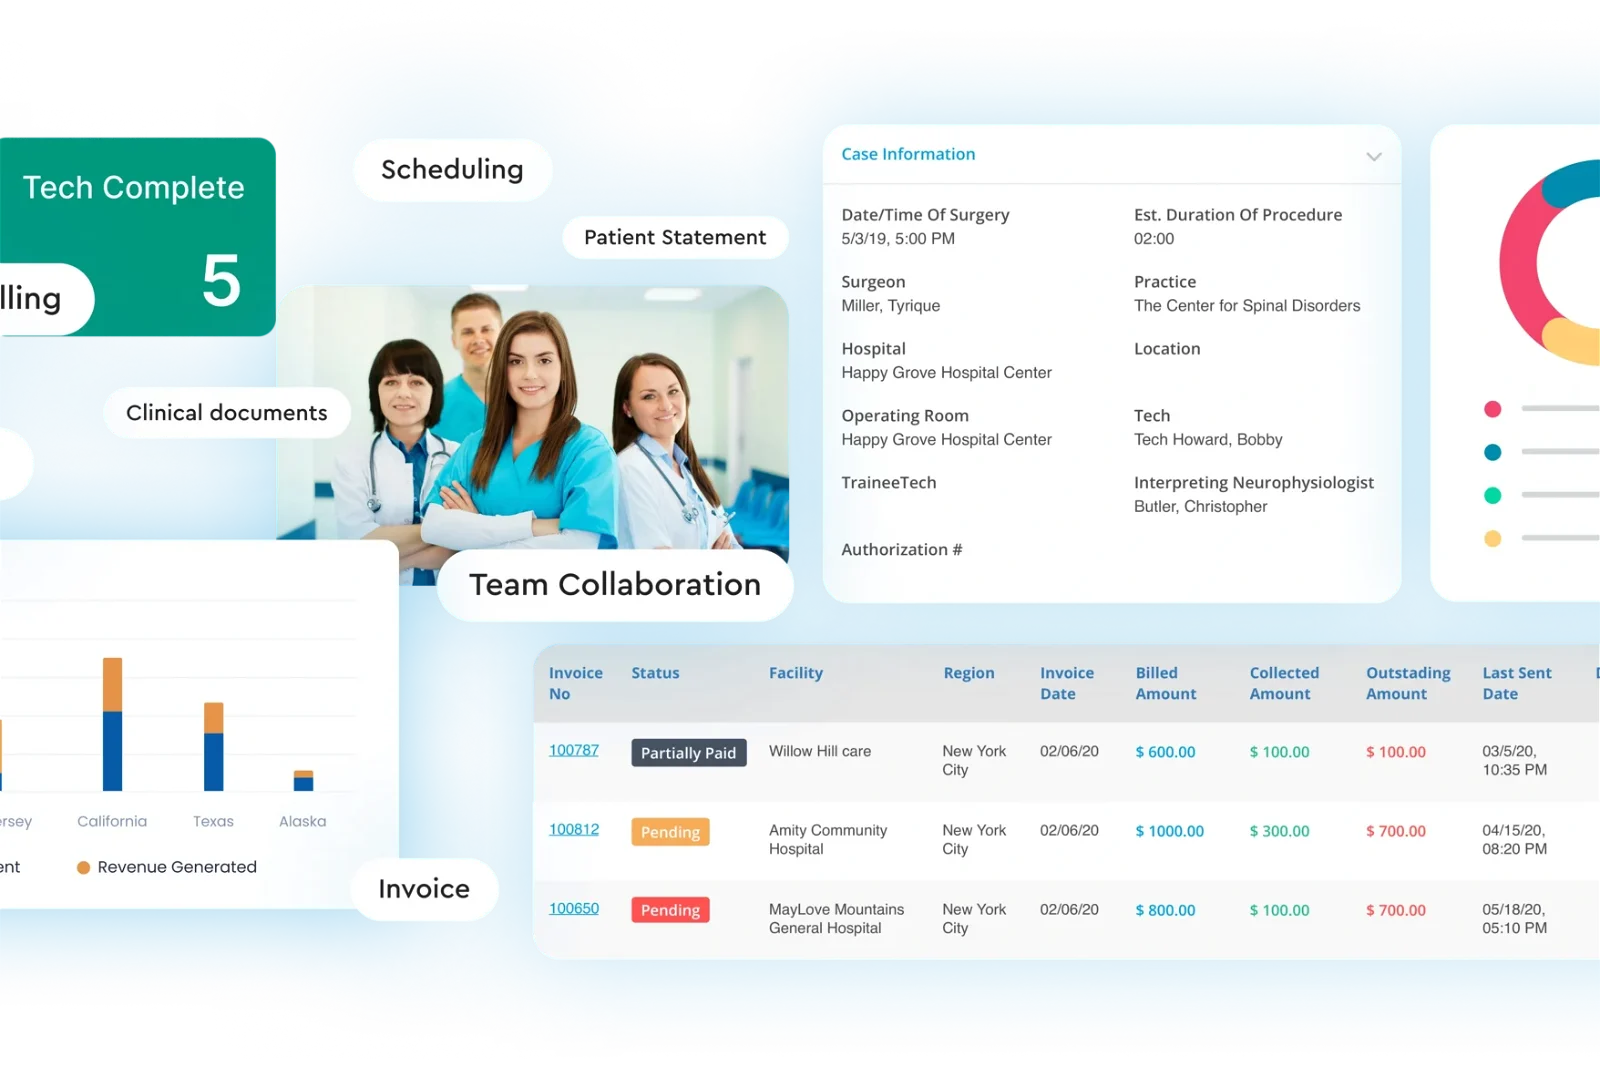
Use Case: This type of Power BI dashboard proves invaluable across various industries, allowing professionals to dive into dynamic datasets. In the healthcare sector, for instance, it aids in real-time patient data analysis, while in manufacturing, it facilitates the examination of production processes.
2. Power BI Analytical Dashboard
Analytical dashboards are tailored for profound data analysis. They incorporate advanced visuals like scatter plots, heat maps, and key performance indicators (KPIs). Typically utilized by data analysts and power users, these dashboards provide insights from intricate datasets.
Use Case: Industries such as education benefit from analytical dashboards for deep dives into academic performance data. In the sports and fitness sector, performance analysts use it to scrutinize player statistics.
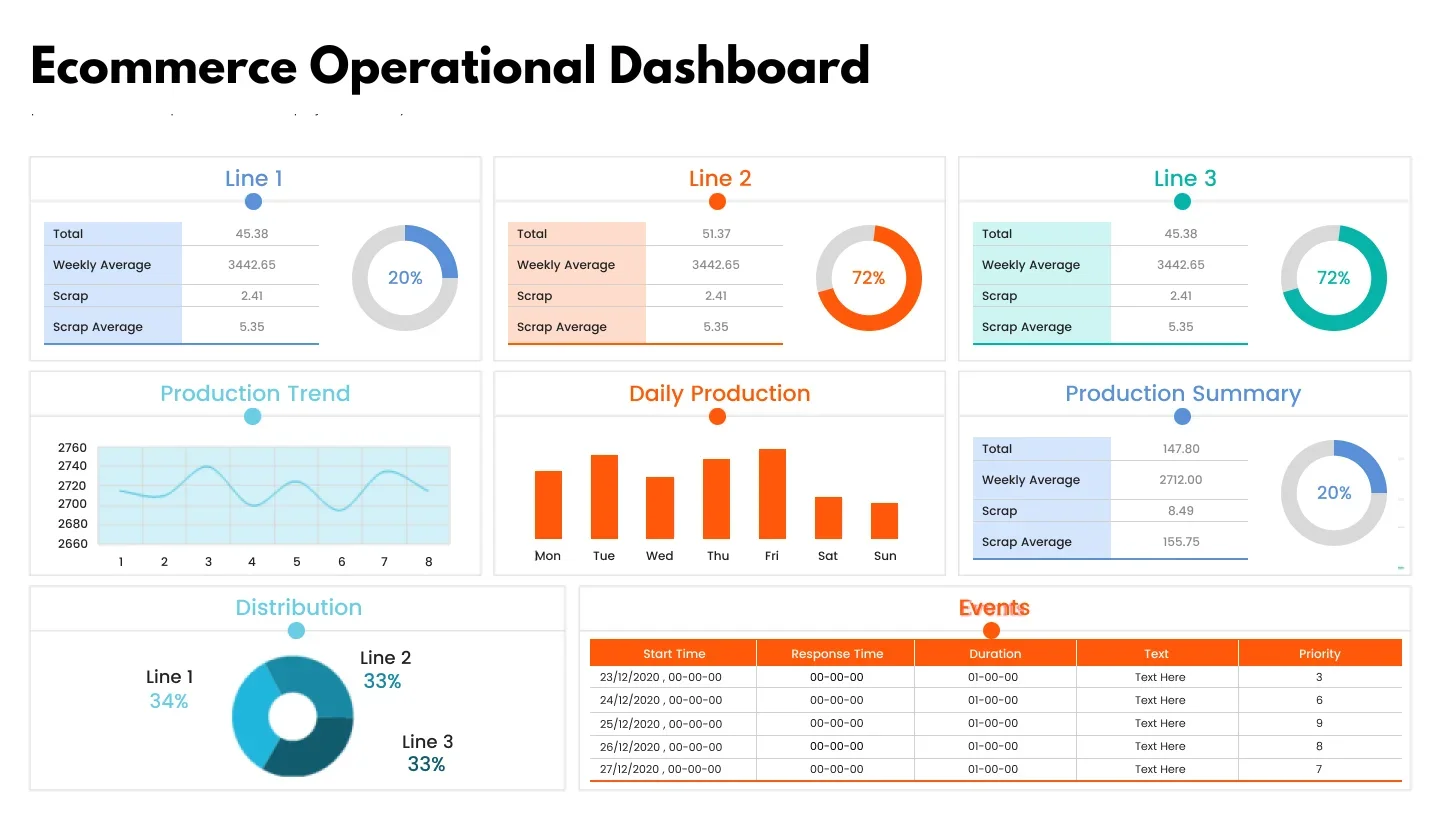
3. Operational Dashboard With Power BI
Operational dashboards deliver real-time or near-real-time data updates, commonly used to monitor key business metrics and performance indicators. Often displayed on large screens in control rooms or offices, these dashboards facilitate continuous tracking of business operations.
Use Case: In the e-commerce sector, operational dashboards aid in monitoring real-time sales and website traffic. In healthcare, these dashboards provide instant updates on patient statuses.
4. Strategic Power BI Dashboard
Strategic dashboards concentrate on presenting high-level, summarized information and key strategic metrics. Typically used by executives and decision-makers, they serve as a comprehensive tool to monitor the overall health of the organization and track progress toward strategic goals.
Use Case: In the manufacturing industry, strategic dashboards help executives oversee production goals and performance. In education, these dashboards offer a summarized view of institutional effectiveness.
5. Performance Tracking With Scorecard Dashboard
Scorecard dashboards are utilized to track performance against predefined metrics and targets. They often include KPIs, traffic light indicators, and trend analysis, ensuring organizations meet their performance objectives.
Use Case: In the financial sector, scorecard dashboards aid in tracking key financial metrics. In the sports and fitness industry, they help assess athlete performance against set benchmarks.
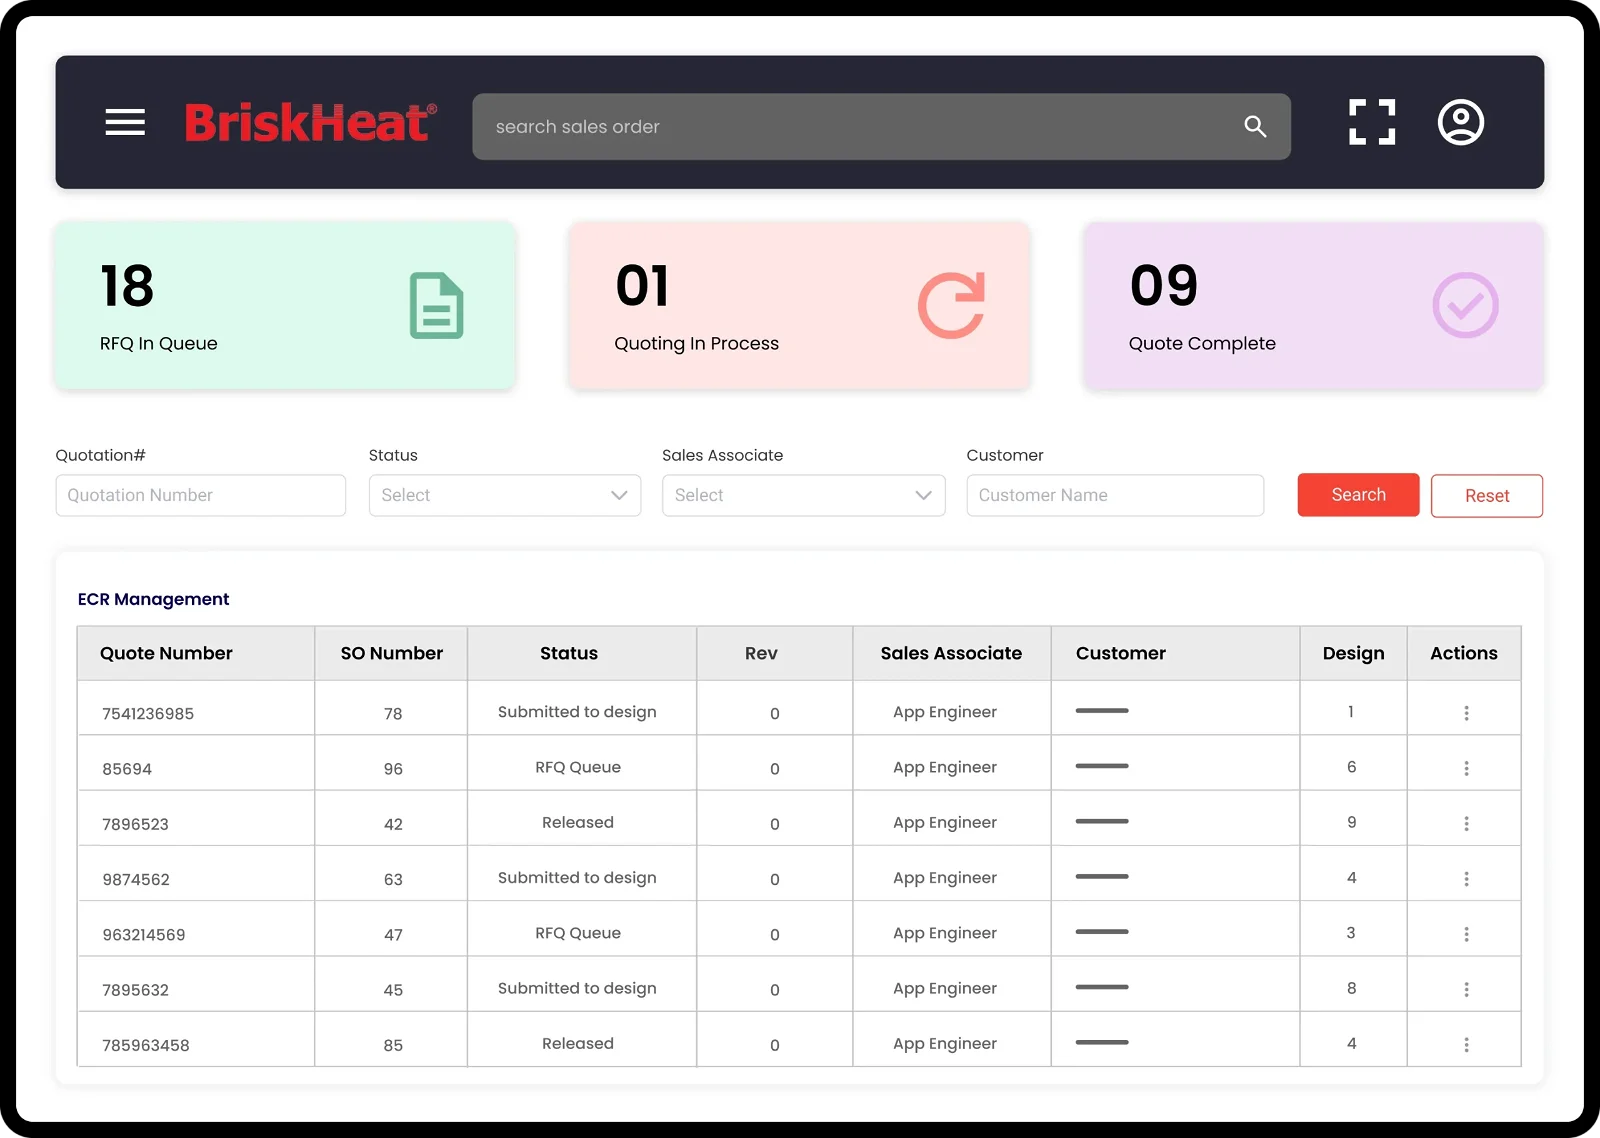
6. Management Dashboard with Power BI
Management dashboards provide a comprehensive view of various aspects of business operations. They may include financial data, sales data, inventory levels, and other metrics that managers need to make informed decisions.
Use Case: In healthcare, Power BI management dashboards assist in overseeing patient care metrics. In the e-commerce sector, they offer insights into inventory levels and sales data.
7. Power BI Financial Dashboard
The Power BI financial dashboard focuses on presenting financial data such as revenue, expenses, profit margins, and cash flow. These dashboards help finance teams and executives monitor financial performance and identify trends.
Use Case: Essential in the healthcare sector to monitor budget allocations and expenditures. In education, financial dashboards assist in tracking institutional spending and resource allocation.
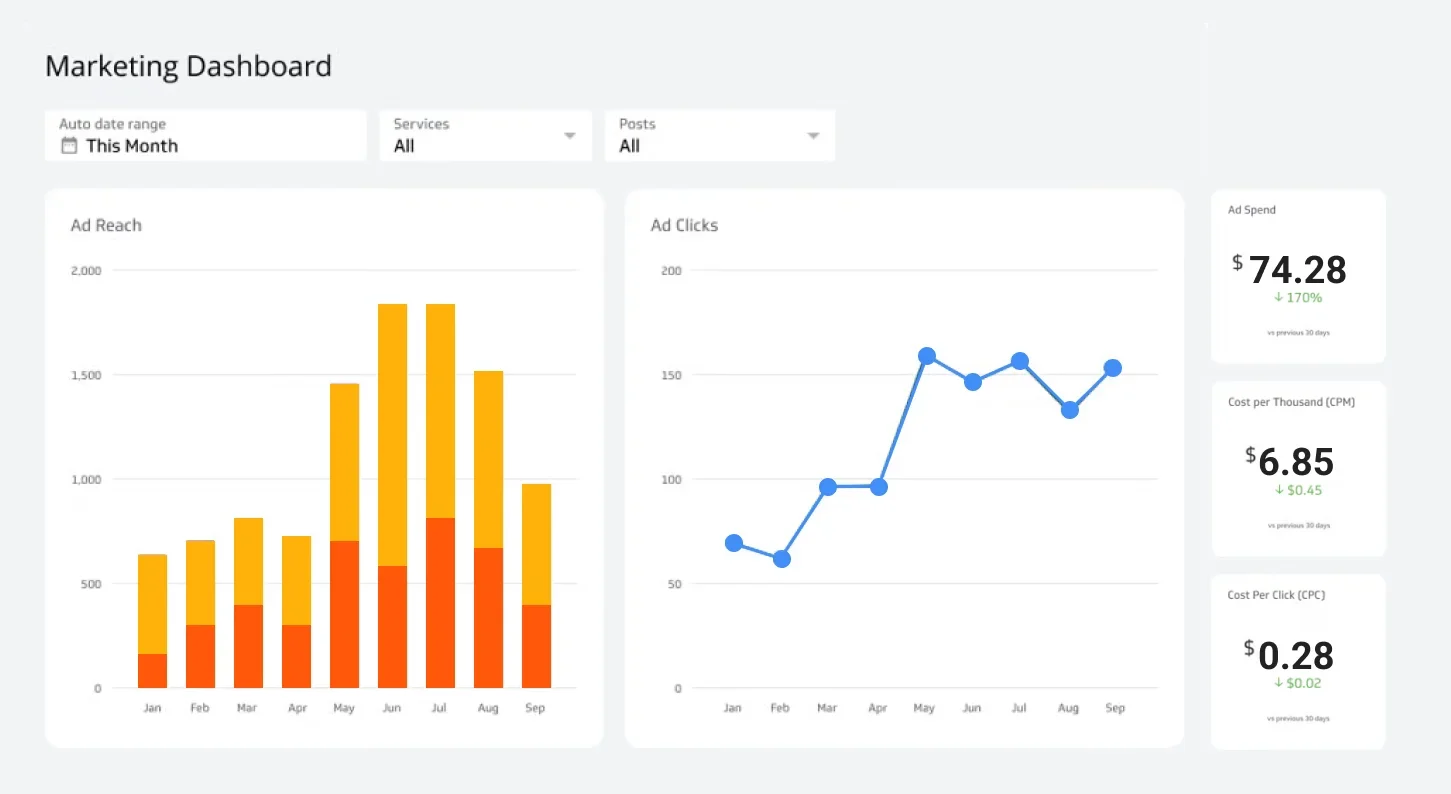
9. Power BI for Marketing
Marketing dashboards display metrics related to marketing campaigns, lead generation, website traffic, and customer engagement. Marketers use these dashboards to assess the effectiveness of their strategies.
Use Case: In education, marketing dashboards help institutions evaluate the effectiveness of recruitment campaigns. In sports and fitness, they assist in tracking fan engagement and marketing strategies.
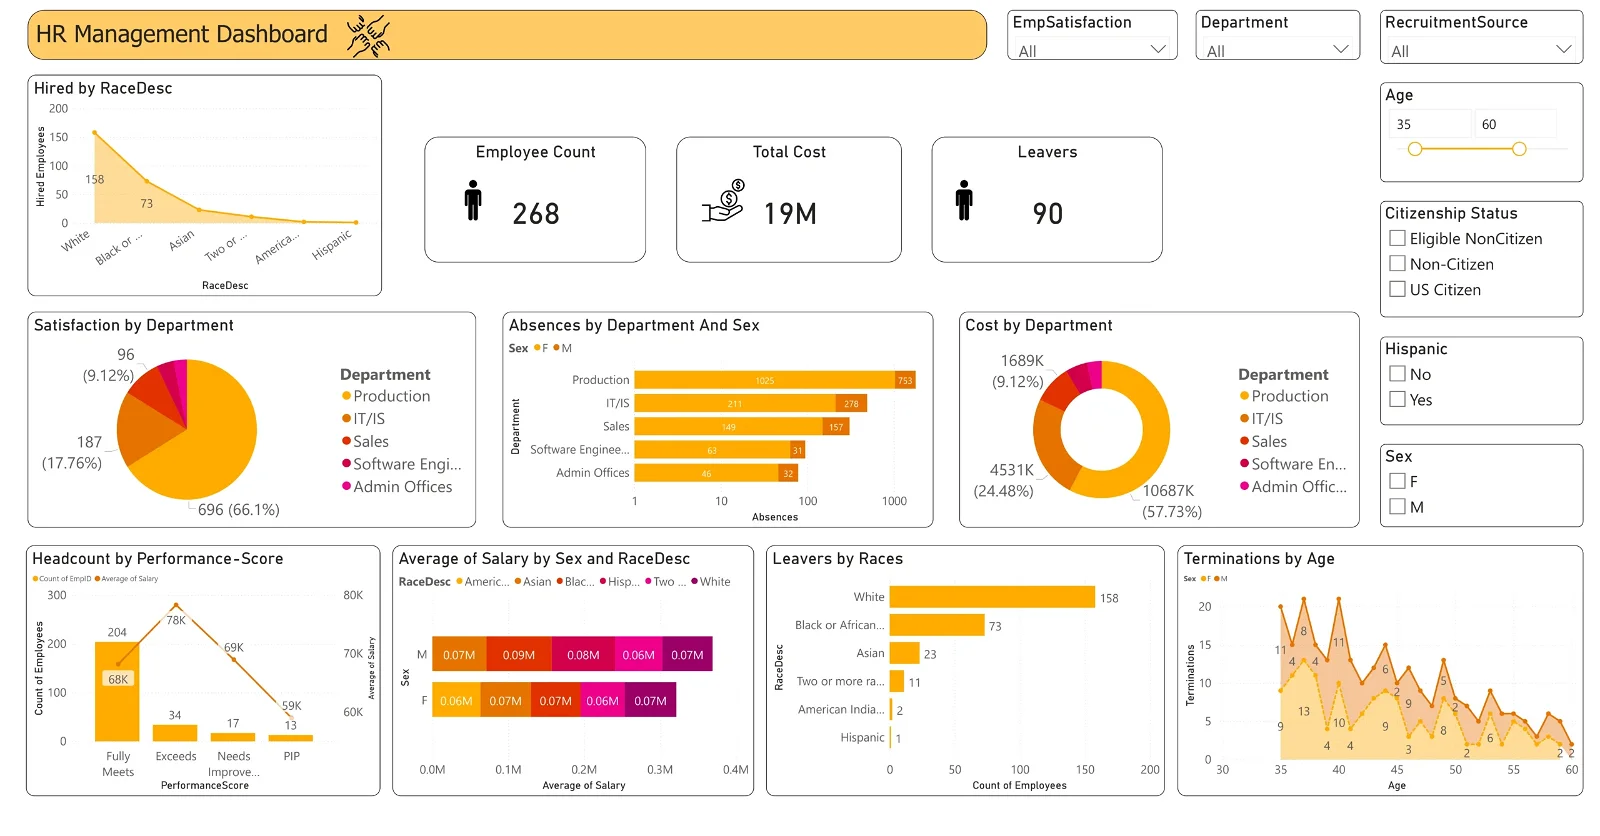
10. Power BI Human Resources (HR) Dashboard
Power BI HR dashboard present employee-related metrics such as headcount, turnover rates, performance evaluations, and training data. HR professionals use these dashboards to manage workforce and organizational development.
Use Case: In healthcare, HR Power BI dashboard assist in managing staff schedules and performance evaluations. In manufacturing, human resources Power BI dashboard aid in tracking workforce development and training data.
Future Trends in Power BI Dashboards
Staying ahead of the curve is essential in the ever-evolving realm of business intelligence. Explore these future trends in Power BI dashboards to harness the full potential of your analytics strategy:
1. Artificial intelligence and Machine Learning
AI and Machine Learning are already making significant contributions to data visualization and analytics. In the future, Power BI Dashboards will incorporate these tools to provide more accurate insights and predictions. These features will allow businesses to anticipate and solve problems before they even occur.
2. Increased Personalization
Currently, Power BI Dashboards offer a high degree of customization and personalization. However, future trends suggest that they will become even more personalized to conform to each user’s preferences. This level of personalization will enable users to quickly and effortlessly find the information they need, without having to sift through irrelevant data.
3. Collaboration
Collaboration and teamwork are essential ingredients for the success of any business. Power BI Dashboards will continue to evolve to facilitate collaboration between team members. Moreover, these dashboards will enable real-time updates, file sharing, and seamless integration with other Microsoft Office products. These features will also allow businesses to collaborate with external stakeholders, such as suppliers, customers, and partners.
4. Integration with Various Data Sources
As businesses continue to accumulate and store vast amounts of data, they will require a dashboard that can integrate with all relevant data sources. In the future, Power BI Dashboards will integrate effortlessly with all data sources, eliminating the need to switch between multiple applications. These dashboards will also provide detailed and real-time analysis of data from diverse sources in a single, unified view.
5. Mobile Accessibility
The way we work is changing, and more employees are working remotely than ever before. Therefore, future Power BI Dashboards will need to be optimized for mobile accessibility. These features ensure that employees can receive information and insights on the go, regardless of their location.
Conclusion
Power BI dashboards are more than just tools, they are a collection of solutions that enable users to create unique interfaces for their work. Many businesses have now embraced different types of Power BI dashboards, for instance AMOT, a manufacturing business, has harnessed Power BI dashboard development services to transform raw data into a valuable asset. The result? Countless saved hours in manual analysis, expediting decision-making.
Sunflower Lab has been a reliable partner for easy Power BI integration. Contact us today to bring out the full power of customized dashboards that meet your business needs.
Drive Success with Our Tech Expertise
Unlock the potential of your business with our range of tech solutions. From RPA to data analytics and AI/ML services, we offer tailored expertise to drive success. Explore innovation, optimize efficiency, and shape the future of your business. Connect with us today and take the first step towards transformative growth.
You might also like
Stay ahead in tech with Sunflower Lab’s curated blogs, sorted by technology type. From AI to Digital Products, explore cutting-edge developments in our insightful, categorized collection. Dive in and stay informed about the ever-evolving digital landscape with Sunflower Lab.