In finance, keeping ahead requires more than simply numbers on a spreadsheet. It necessitates a thorough comprehension of financial data and the ability to translate it into meaningful insights. This is where the Power BI Financial Dashboard comes in, providing a strong toolbox that enables finance professionals to sail through the complexity of financial management with simplicity and accuracy.
The key advantage of the Power BI Financial Dashboard is that it opens a new window for users that shows the status of finances and enables them to find hidden secrets that are not obvious to the eyes. Power BI is indeed a multi-sourced tool that not only consolidates data but also facilitates data analysis and the creation of interactive visualizations. At the end of all of this, financial professionals shouldn’t especially feel that Power BI development services are limited to their particular demands and that there are multiple reasons why these dashboards will be their best bet.
Why Is Power BI Useful for Finance?
Financial management is a complex and dynamic field, presenting various challenges that can impede efficiency and decision-making. Power BI Financial Dashboard, with its advanced capabilities, addresses these challenges head-on, empowering finance professionals to navigate the financial landscape effectively.
- Data Complexity: Financial data is often complex, requiring thorough analysis to derive meaningful insights. Power BI simplifies data analysis and processing, enabling finance professionals to uncover valuable insights quickly and make informed decisions.
- Forecasting Accuracy: Accurate forecasting is crucial for financial planning and decision-making. The Power BI dashboard equips advanced data analytics tools to enhance forecasting accuracy by analyzing historical data trends and identifying patterns, enabling finance professionals to predict future financial outcomes with confidence.
- Compliance Management: Compliance with regulatory requirements is a key concern for financial institutions. Power BI helps streamline compliance management by providing tools to monitor and report on compliance metrics, ensuring that organizations adhere to regulatory standards.
- Risk Identification and Mitigation: Identifying and mitigating risks is essential for maintaining financial stability. Power BI’s risk management tools help finance professionals identify potential risks, assess their impact, and develop strategies to mitigate them, reducing the likelihood of financial loss.
- Operational Efficiency: Improving operational efficiency is a constant goal for finance departments. The Power BI financial dashboard streamlines financial processes, automates repetitive tasks, and provides real-time insights, enhancing overall operational efficiency and productivity.
- Strategic Decision-Making: Making strategic decisions requires access to accurate and up-to-date information. Power BI’s real-time reporting capabilities provide finance professionals with the information they need to make informed decisions quickly, ensuring that organizations stay ahead of the competition.
- Customer Insights: Understanding customer behavior and preferences is crucial for financial institutions. Power BI’s analytics tools help finance professionals analyze customer data, gain valuable insights, and tailor their products and services to meet customer needs effectively.
Types of Power BI Financial Dashboards in Power BI
On the path to financial clarity, Microsoft Power BI dashboards serve as reliable guides, directing us through the twists and turns of fiscal management. They are more than simply graphs and figures; they are like maps that guide us through our financial strategies. Let’s discuss some of the most valuable dashboards available in Power BI Financial Dashboard that might aid in keeping you financially responsible and your finance team on schedule
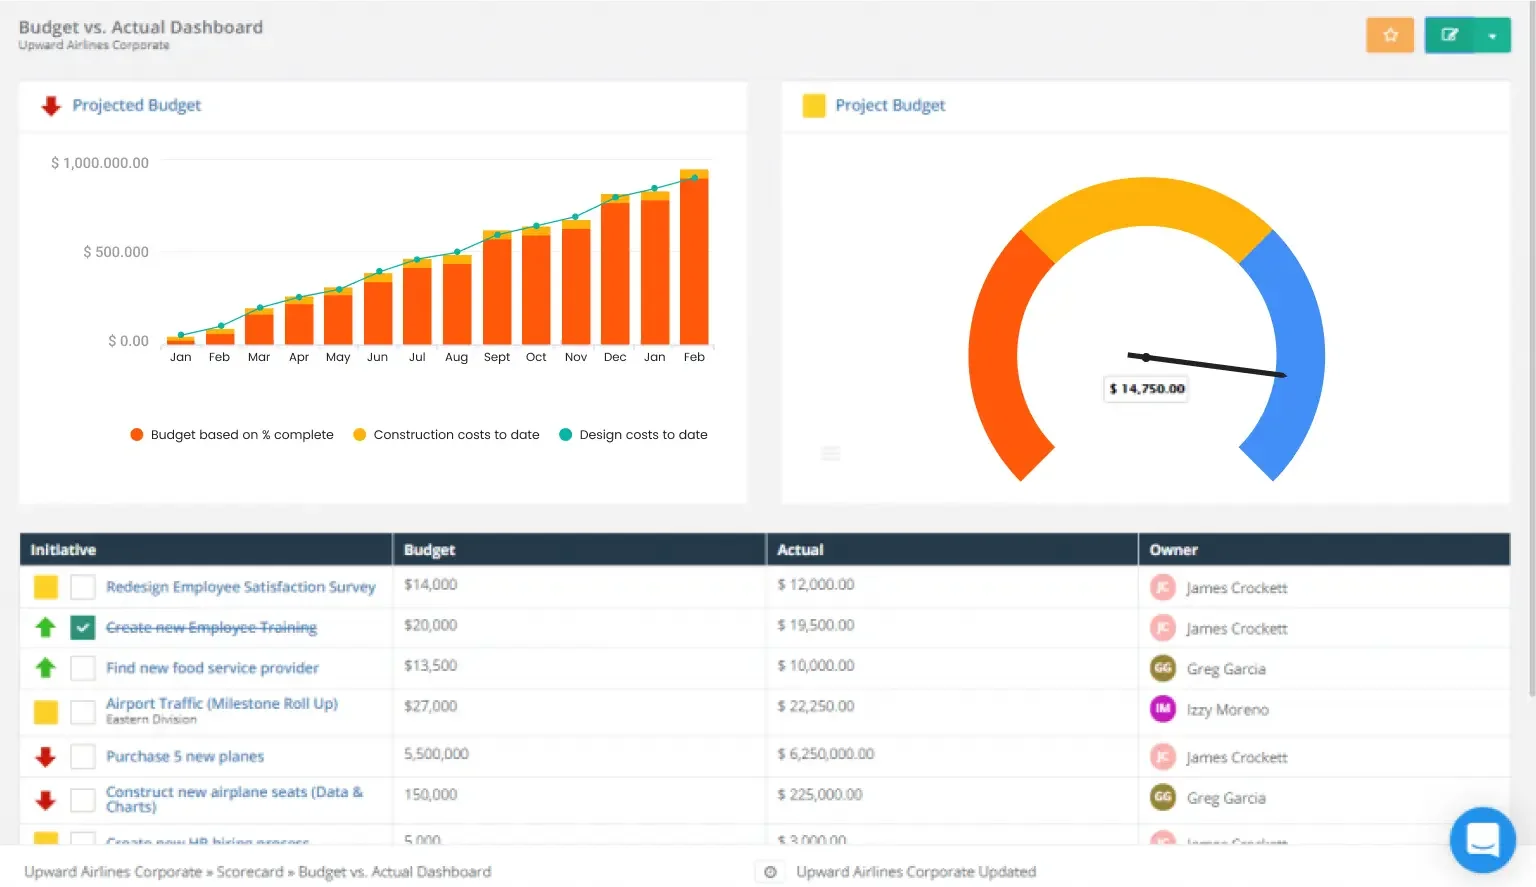
1. Budgeting and Forecasting Dashboard
The Budgeting and Forecasting Dashboard is a critical tool for businesses to effectively plan and manage their finances. It allows organizations to track actual expenses against budgeted amounts, providing insights into spending patterns and variances. Additionally, this dashboard enables businesses to forecast future financial performance based on historical data and trends. By utilizing this information, finance teams and businesses can make informed decisions to optimize their budgeting processes and achieve their financial goals.
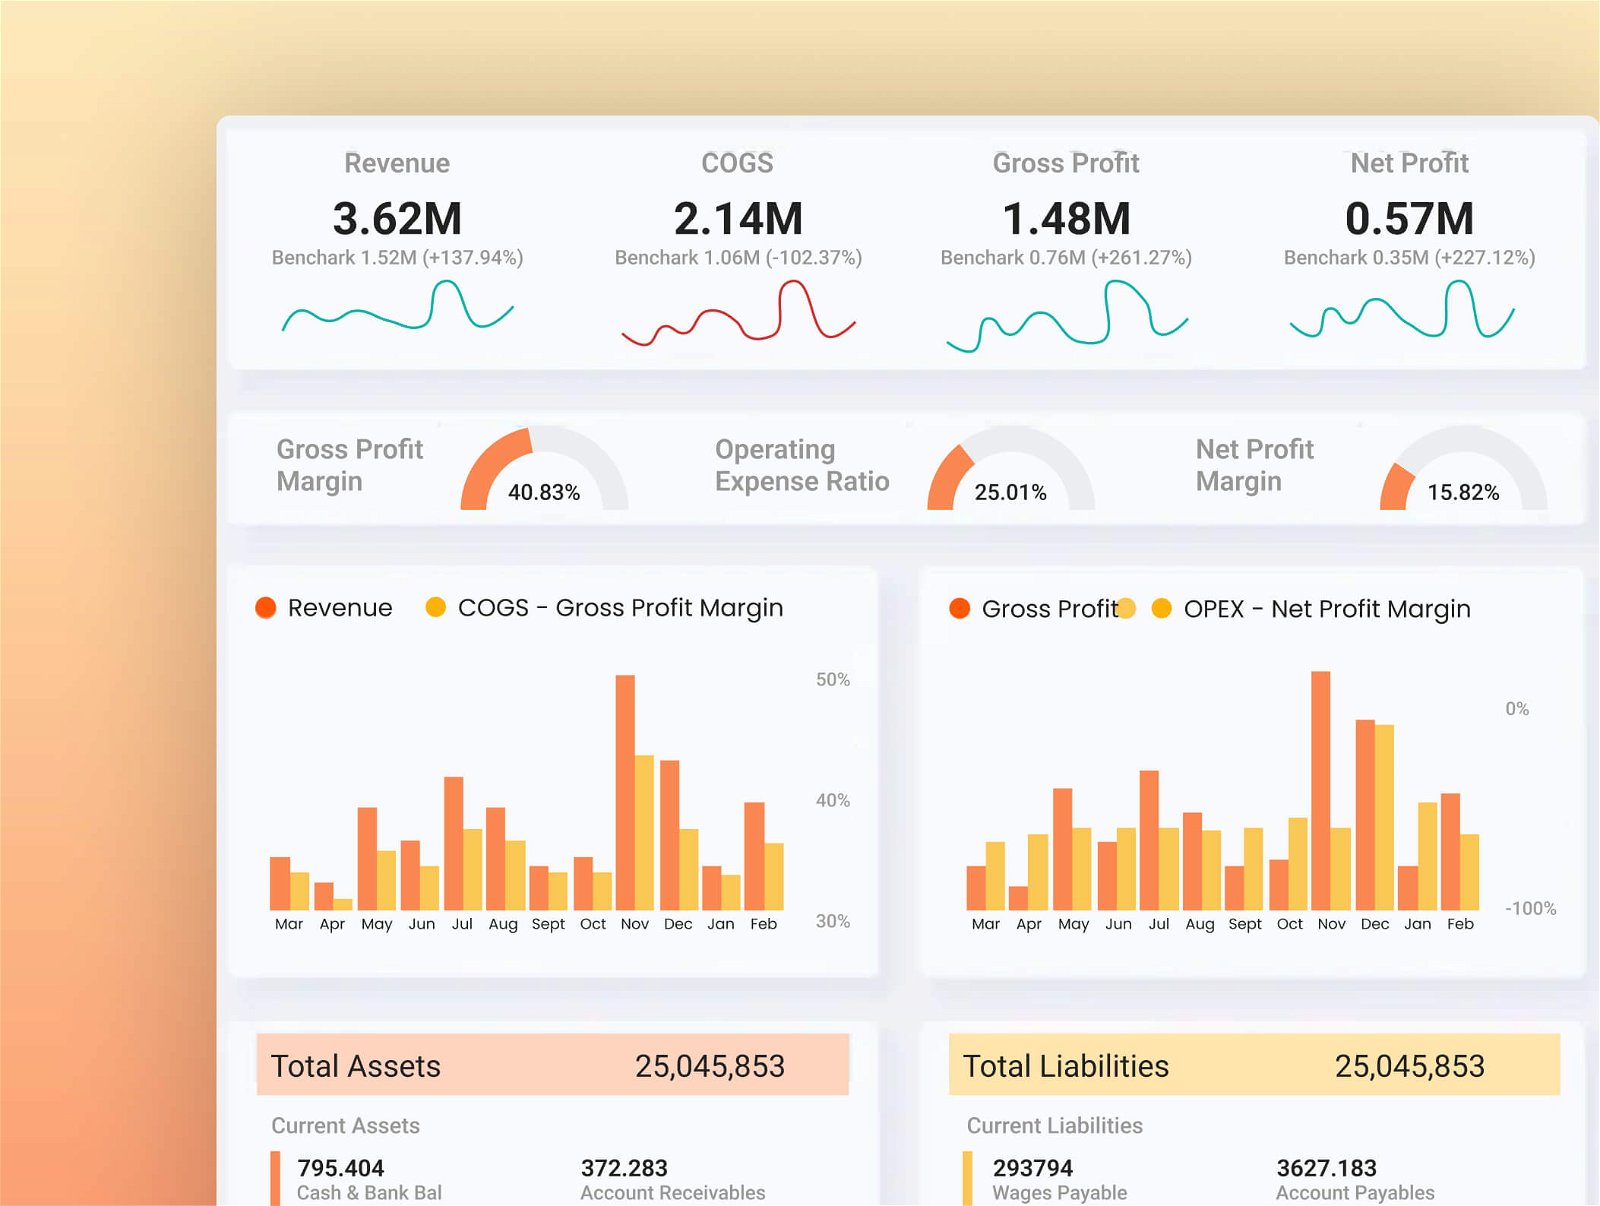
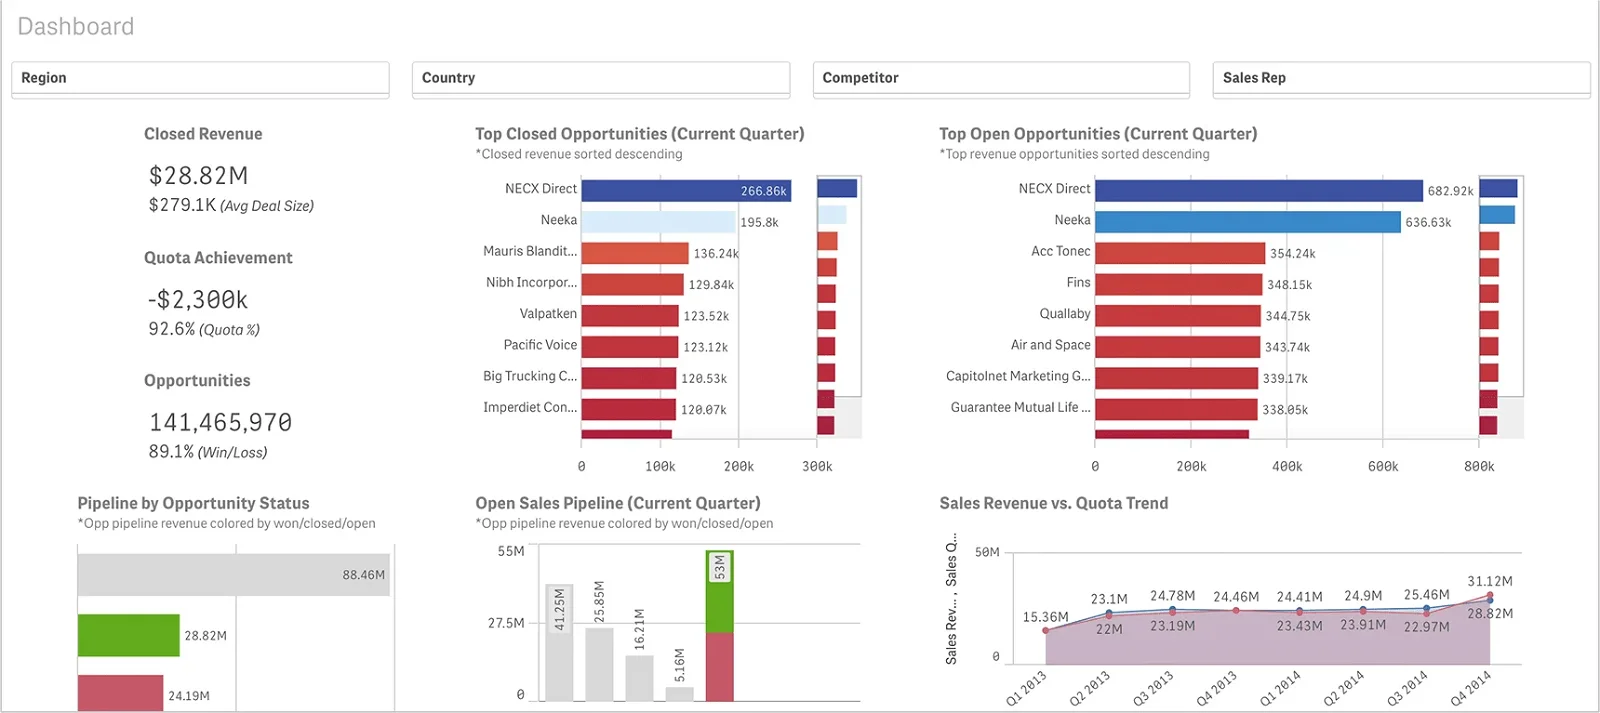
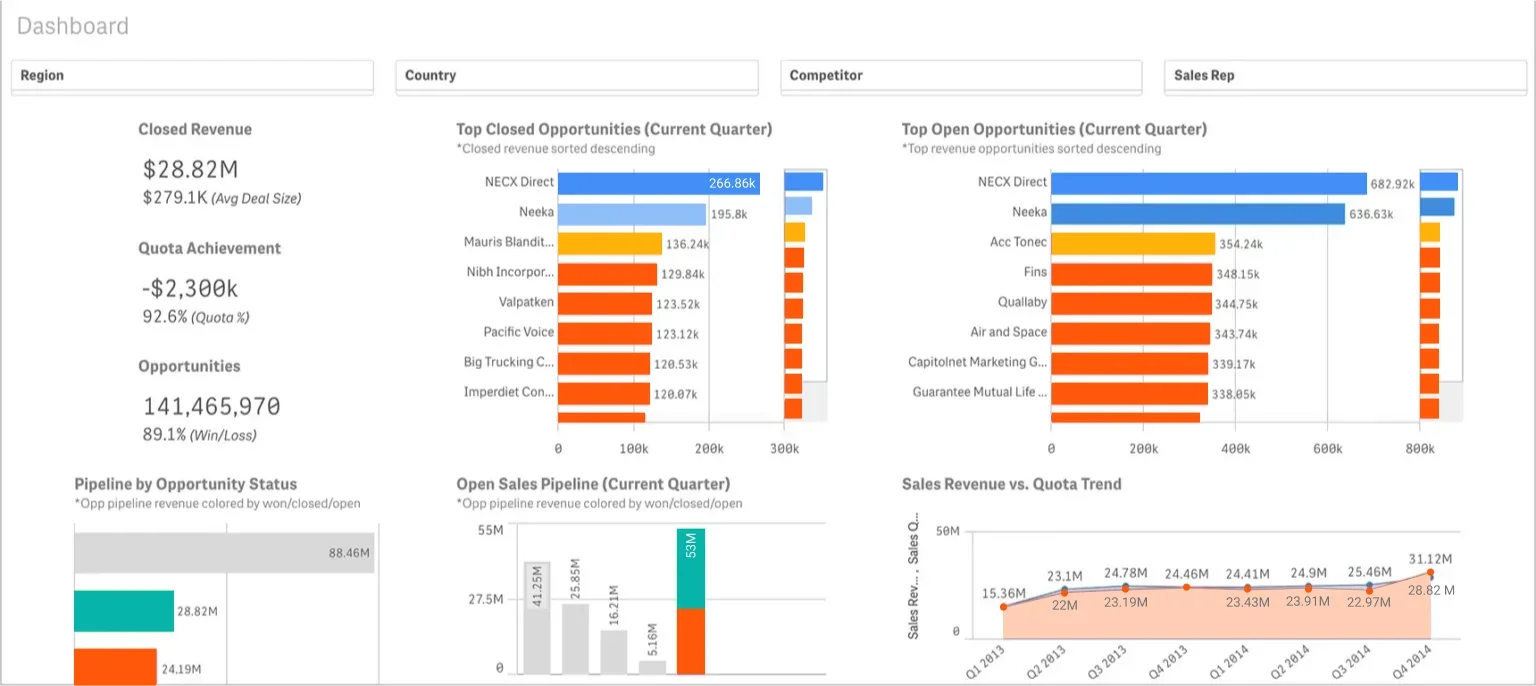
2. Financial Performance Dashboard
The Financial Performance Dashboard thoroughly presents an organization’s financial health. It includes key metrics such as revenue, expenses, profit margins, and cash flow, allowing stakeholders to assess the overall financial performance of the business. This dashboard enables businesses to identify trends, opportunities, and challenges, helping them make informed decisions to drive growth and profitability.
3. CFO Dashboard
The CFO Dashboard is designed to provide financial leaders with a high-level view of the company’s financial performance. It includes metrics such as return on investment (ROI), profitability ratios, and cost management indicators, allowing CFOs to monitor financial efficiency and growth. This dashboard enables CFOs to identify areas for improvement, make strategic decisions, and drive the company’s financial success.
4. Profit and Loss Dashboard
The Profit and Loss Dashboard summarizes the revenues, costs, and expenses for a specific period, typically a fiscal quarter or year. It provides a detailed breakdown of income sources and expenditure categories, allowing businesses to analyze their financial performance. This dashboard helps businesses track profitability, identify areas for improvement, and make informed decisions to optimize financial performance.
5. Sales Dashboard in Power BI
The Sales Dashboard in Power BI tracks sales performance, trends, and related metrics to analyze revenue generation. It provides insights into sales volumes, product performance, and customer behavior, enabling businesses to identify sales opportunities and improve sales strategies. This dashboard helps monitor the sales performance of the team against targets and drive revenue growth.
6. Revenue Dashboard
The Revenue Dashboard breaks down company revenue to show the factors driving changes more clearly. It provides insights into revenue sources, pricing strategies, and market trends, helping businesses optimize their revenue streams. This dashboard enables businesses to identify opportunities for revenue growth and make informed decisions to maximize profitability.
7. CAGR Dashboard
The Compound Annual Growth Rate (CAGR) Dashboard represents the growth rate that would take an initial value to the ending investment value, assuming compounding over time. It is a useful tool for analyzing investment performance and comparing growth rates across different investment opportunities. This dashboard helps businesses evaluate the long-term growth potential of investments and make informed decisions to maximize returns.
8. Cashflow Dashboard
The Cashflow Dashboard monitors cash inflows and outflows to ensure adequate liquidity and financial stability. It provides insights into cash flow patterns, liquidity ratios, and cash management practices, helping businesses manage their cash flow effectively. This dashboard enables businesses to identify potential cash flow problems and take proactive measures to maintain financial stability.
9. Executive Dashboard
The Executive Dashboard offers high-level visibility into business health for C-suite executives, investors, and board members. It includes key financial metrics and KPIs, such as revenue growth, profitability, and ROI, presented in a clear and concise format. This dashboard enables executives to quickly assess the company’s financial performance and make strategic decisions to drive business growth.
Exploring Industry-Specific Power BI Financial Dashboards
It’s important to note that the Power BI financial dashboard is far from generic. They are carefully built to match the individual demands of numerous sectors, demonstrating an exceptional capacity to adapt to and reflect the distinct parameters that drive business success. By capturing the unique characteristics of each sector, a Power BI developer creates a dashboard that transforms into a dynamic solution that easily integrates with the complex ecosystems of the businesses it supports.
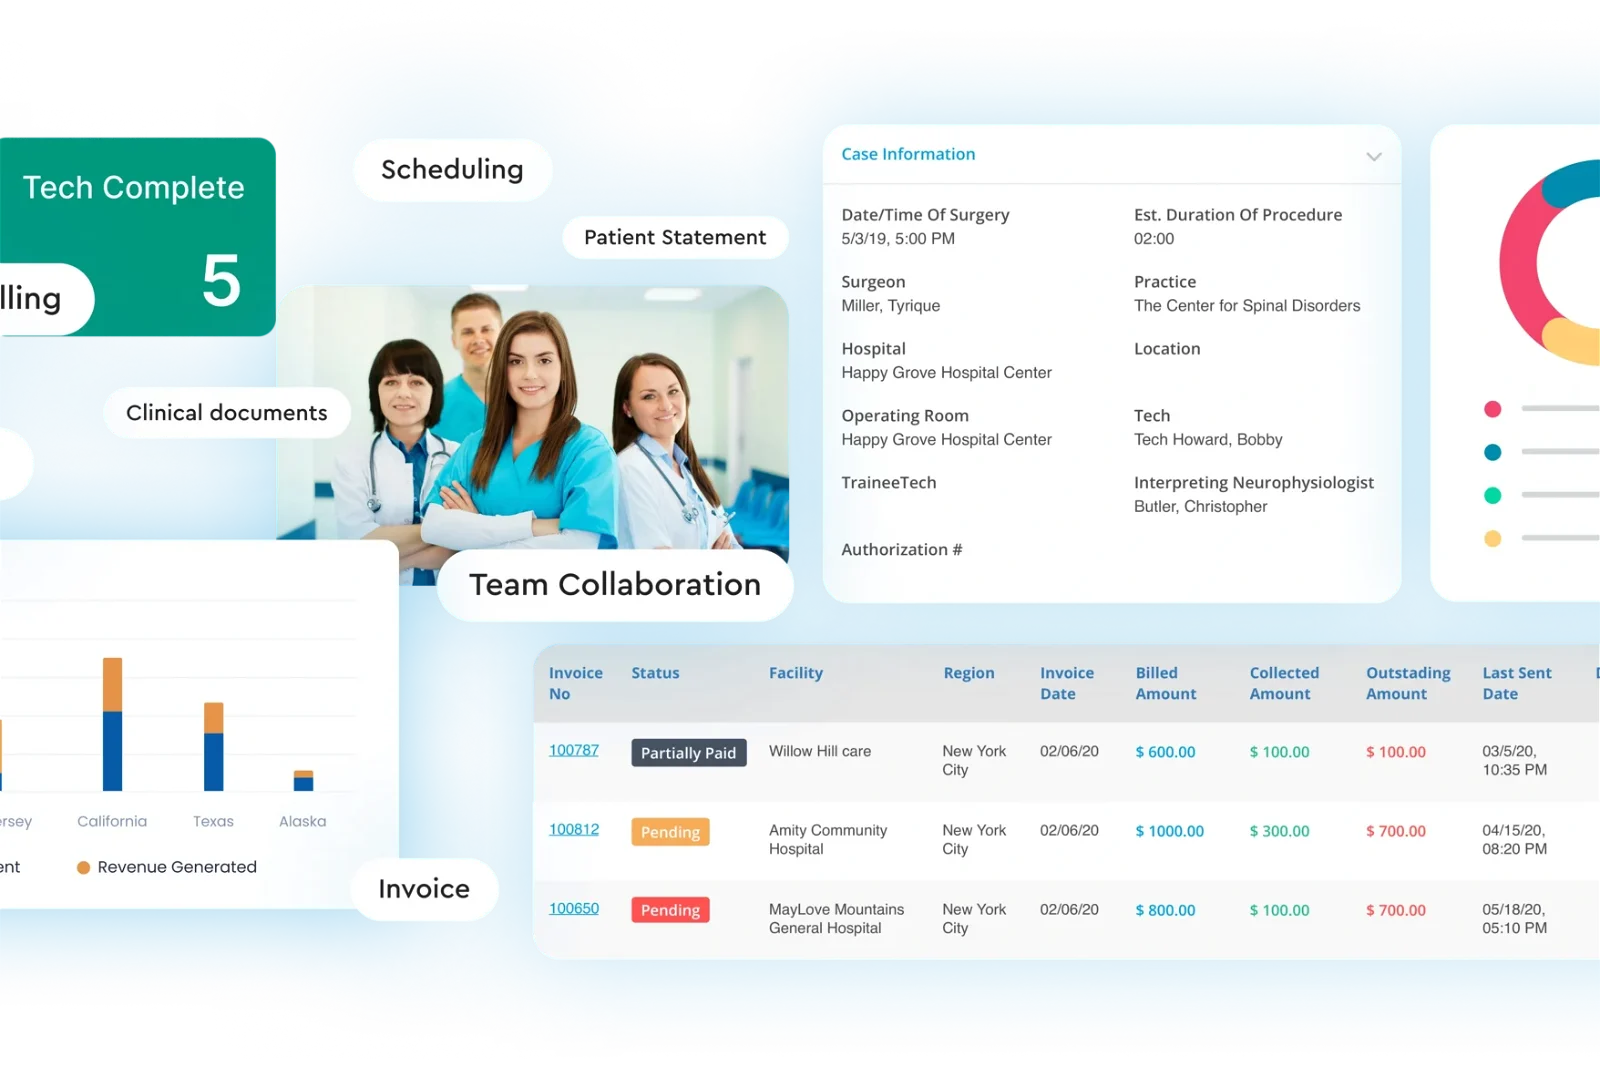
Healthcare Industry
In healthcare, the Power BI financial dashboard is instrumental in managing costs, optimizing revenue cycles, and enhancing patient care. These dashboards offer complete views of key metrics such as patient volumes, reimbursement rates, and operational efficiency. Hospitals and healthcare providers can use financial Power BI dashboards to monitor bed occupancy rates, analyze revenue per patient, and track expenses related to medical supplies. Healthcare businesses can make data-driven decisions that enhance patient care and ensure financial sustainability by using these insights.
Manufacturing Industry
In the industrial sector, financial Power BI dashboard development serves a deeper purpose because it offers real-time visibility into production costs, inventory levels, and supply chain performance. These dashboards provide information on factors like labor expenditures, equipment usage, and raw material prices. A manufacturing facility, for instance, may check production costs per unit, examine inventory turnover rates, and keep an eye on cash flow by using a financial dashboard. Manufacturers may find inefficiencies, simplify processes, and increase profitability by using these insights.
Wellness and Fitness Industry
In the wellness and fitness sector, financial Power BI dashboards can be used for managing membership revenues, tracking expenses, and analyzing profitability. These dashboards encompass metrics such as membership growth, average revenue per member, and marketing ROI. Fitness centers and gyms can utilize financial dashboards to track membership renewals, analyze class attendance rates, and monitor revenue trends. With these insights, businesses in the wellness and fitness industry can refine their marketing strategies, improve member retention, and drive financial success.
Education Industry
Financial dashboards bring transformation and transparency to the education sector by offering insights into budgets, funding sources, and student enrollment data. These Power BI dashboards provide valuable metrics such as tuition revenue, grant funding, and per-student costs. For instance, a university could use a financial dashboard to track student enrollment trends, analyze scholarship expenditures, and monitor fundraising efforts. By utilizing these insights, educational institutions can make data-driven decisions to optimize resources and enhance financial stability.
Power Up Your Business Intelligence with Power BI
Turn complexity into clarity with our user-friendly Power BI solutions.
Using Power BI Financial Dashboards
The Microsoft Power BI dashboard stands out as a powerful tool for financial analysis and reporting, offering a wide array of features that enable users to visualize and analyze financial data with precision and ease. One of its standout features is the ability to create dynamic and interactive financial dashboards, which serve as invaluable tools for gaining insights and making informed decisions regarding financial performance.
How Do You Use This Report?
Each Power BI dashboard has a distinct function designed to satisfy particular requirements. Before beginning dashboard construction, it is very important to specify the dashboard’s primary application and target audience. This stage makes sure that the dashboard design is in line with your financial goals, which improves its ability to offer relevant information and facilitate well-informed decision-making.
- Connect to Data: To begin, users must connect their Power BI dashboard to relevant data sources. These sources can vary widely, including Excel spreadsheets, SQL databases, or cloud-based services like Azure. Establishing this connection is crucial, as it forms the foundation for all subsequent analysis.
- Create Visualizations: Once data is connected, users can leverage Power BI’s intuitive drag-and-drop interface to create visualizations based on their financial data. These visualizations can take various forms, including charts, graphs, and tables, each designed to effectively represent critical metrics such as revenue, expenses, and profits.
- Customize Dashboard: Customization is critical in making the dashboard meet specific needs. Users can add filters, slicers, and other interactive elements to facilitate detailed data exploration, ensuring that the dashboard aligns with their unique analytical requirements.
- Analyze Data: With visualizations in place, users can examine their financial data to identify trends, outliers, and areas for improvement. Through careful data analysis, users can gain valuable insights that can inform strategic decision-making and drive business growth.
- Share and Collaborate: Once analysis is complete, users can share their dashboard with colleagues within their organization. Power BI’s collaboration features enable multiple users to view and interact with the Power BI dashboard concurrently, fostering a collaborative approach to financial analysis.
Power BI Financial Dashboard Data Visualizations
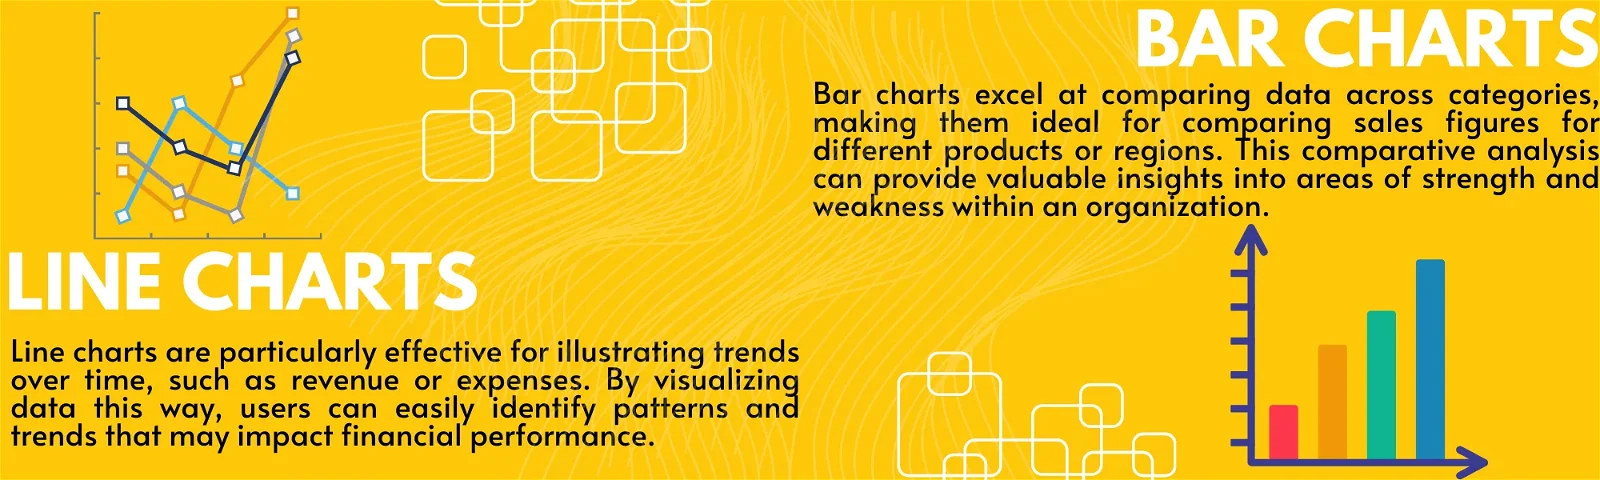
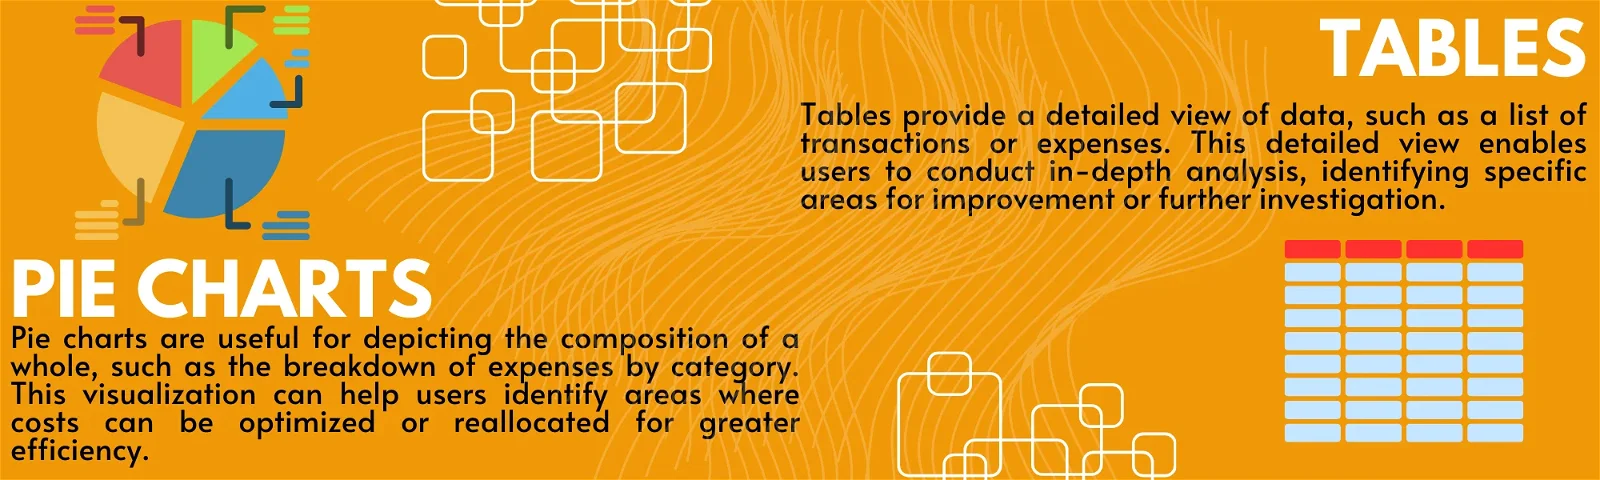
The art of financial reporting is not just about the numbers; it’s about how you represent them. You can give your financial data a creative touch and enhance its readability and appeal to viewers. All this is possible by utilizing the wide range of data visualization offered by the Power BI financial dashboard. From interactive charts like line charts and pie charts to dynamic graphs, Power BI offers a multitude of tools to transform your financial numbers into a visually appealing story that speaks volumes.
What Are the Benefits of Using Power BI Financial Dashboards?
Power BI offers a host of benefits for organizations seeking to enhance their financial data analysis and reporting capabilities. From enhanced data visualization to scalability, Power BI Financial Dashboards provide a comprehensive solution for financial management. Here are some key benefits that will want you to contact a Power BI dashboard development provider immediately:
1. Enhanced Data Visualization: Power BI’s strong visualization capabilities enable users to create visually stunning and interactive dashboards. These visuals make it easier to understand complex financial data, spot trends, and identify insights that drive business growth. With features like customizable colors, styles, and responsive elements, users can create dynamic visualizations that enhance data conception and analysis.
2. Real-Time Reporting: One of Power BI’s standout features is its ability to access real-time financial data. This capability ensures that decisions are based on the most current information available, allowing organizations to respond swiftly to market changes and make informed decisions. Real-time reporting is particularly valuable for monitoring key metrics, tracking performance, and identifying areas for improvement.
3. Customizable Dashboards: Power BI offers unparalleled flexibility in dashboard customization. Users can tailor dashboards to their specific needs, choosing the metrics, visuals, and layout that best suit their analysis requirements. This customization extends to interactive elements like filters, slicers, and drill-down capabilities, allowing users to explore data in greater detail and extract valuable insights.
4. Integration with Multiple Data Sources: Power BI seamlessly integrates with a wide range of data sources, including Excel, SQL Server, and cloud-based services like Azure. This integration allows users to consolidate financial data from various sources, providing a holistic view of the organization’s financial health. By integrating data from multiple sources, organizations can gain a comprehensive understanding of their financial performance and make more informed decisions.
5. Accessibility Across Various Platforms: The Power BI dashboard is accessible from desktop computers, tablets, and smartphones, ensuring that users can access critical financial data anytime, anywhere. This accessibility promotes collaboration and enables stakeholders to make informed decisions on the go. Additionally, Power BI offers a mobile app that allows users to view and interact with dashboards on their mobile devices, further enhancing accessibility and convenience.
6. Data Security: Power BI prioritizes data security, offering powerful encryption and access controls to protect financial data from unauthorized access and breaches. This commitment to security ensures that sensitive financial information remains confidential and secure. Power BI also offers compliance with industry standards and regulations, providing organizations with peace of mind regarding their data security practices.
7. Cost-Effective Solution: Power BI offers a range of pricing plans to suit different organizational needs and budgets, making it a cost-effective solution for financial reporting. Compared to traditional business intelligence tools, Power BI provides a comprehensive and affordable option for organizations of all sizes. Additionally, Power BI’s cloud-based model eliminates the need for expensive hardware and infrastructure, further reducing costs and increasing accessibility.
8. Scalability: The Power BI dashboard is highly scalable, making it suitable for organizations at any stage of growth. Whether you’re a small startup or a large enterprise, Power BI can scale to meet your evolving financial analysis and reporting needs. With Power BI, organizations can easily expand their data analytics capabilities as their business grows, ensuring that they can continue to derive value from their data.
Advanced Features in Power BI Financial Dashboards
Power BI excels in financial analysis and reporting, offering a strong suite of features tailored for creating insightful and interactive financial dashboards. These features empower users to connect to diverse data sources, perform complex calculations, design comprehensive visualizations, and manage data processing and preparation. Let’s explore these advanced features further to see how they can enhance your financial reporting capabilities:
1. Connect to Data Sources
Power BI’s strength lies in its ability to seamlessly connect to a wide array of data sources. Whether it’s Excel spreadsheets, SQL databases, cloud-based services like Azure, or web APIs, Power BI’s connectivity options enable users to amalgamate data from multiple sources, thereby creating a holistic and consolidated view of their financial data.
2. Calculated Columns and Measures
Power BI allows users to create calculated columns and measures, enabling them to perform complex calculations on their financial data. Calculated columns are derived from formulas, while measures are calculations applied to the entire dataset. These features empower users to derive valuable insights, such as profit margins, growth rates, and other critical financial metrics, essential for informed decision-making.
3. Create Data Models and Visualizations
With the data modeling ability of the Power BI dashboard, users can create visualizations between different data tables that seem to have no relationship whatsoever. It helps achieve such a highly compounded representation of data through the combination of different sources of data, which in turn gives a complete picture of financial performance. Additionally, explore interactive visualizations such as slicers and filters to reveal the complexity of data and explore financial ocean depths.
4. Transform and Clean Data
Data integrity is a must in financial reporting. Data preparation in Power BI is one of the powerful suites that present a way to keep data up-to-date. Data managers are now able to use these tools to eliminate duplicates, fill in the gaps with missing values, and correctly format data. This assures that the financial data fed into their portfolios is of the utmost quality so that their dashboards can carry out accurate checks.
5. Integration with Other Microsoft Products
Power BI offers powerful integration capabilities with other Microsoft products such as Azure, Dynamics 365, and Office 365, allowing seamless data connectivity and collaboration. It also integrates smoothly with third-party applications like Salesforce, Google Analytics, and Adobe Analytics. This extensive integration ecosystem enhances workflow efficiency by enabling users to access and analyze data from multiple sources within a single dashboard, streamlining decision-making processes for organizations.
Focus on Your Business Goals While we Take Care of Your Data
With the advanced functionality of Power BI, users can spend less time maintaining data and focus more on making better decisions. These features allow users to easily organize complex financial dashboards that offer valuable insights and guide decision-making based on factual data. Whether it’s monitoring key performance indicators, analyzing trends, or forecasting future performance, the advanced features of the Power BI financial dashboard empower every user to access in-depth knowledge of their financial data. This allows businesses to maximize their growth potential and make informed decisions.
Visualizing Success with Power BI Financial Dashboard
AMOT, a manufacturer of industrial valves, sought a digital solution to help its key managers and stakeholders make informed decisions based on data. Sunflower Lab collaborated closely with AMOT to understand its business needs and developed a Power BI dynamic dashboard solution empowered by DAX.
This solution enabled AMOT to access its financial data in real-time, visualizing the company’s financial health, revenue breakdown, profitability metrics, and KPIs, providing a comprehensive overview of extensive international client data. Overall, the Power BI financial dashboard simplified decision-making processes for stakeholders, enhancing AMOT’s operational efficiency and strategic planning capabilities.
Tips for Choosing a Power BI Development Service Provider
Selecting the right Power BI development service provider is crucial for ensuring the success of your analytics initiatives. Here are some key factors to consider:
- Expertise: Look for a provider with a team of highly skilled and experienced Power BI developers who have a deep understanding of data visualization, analytics, and business intelligence.
- Experience: Choose a provider with a proven track record of delivering successful Power BI projects for clients across various industries.
- Industry Specialization: Consider a provider that specializes in your industry, as they will have a better understanding of your unique business requirements and challenges.
- Customer Support: Ensure the provider offers excellent customer support, including timely responses to queries and issues, to ensure smooth project execution and ongoing maintenance.
- Pricing Models: Compare pricing models to find a provider that offers a cost-effective solution without compromising on quality or support. Consider factors such as upfront costs, licensing fees, and ongoing support costs.
Future Trends in Power BI Development
The future of Power BI development services is driven by several exciting trends that are reshaping the analytics scene. These trends signify a shift towards more intelligent and predictive analytics, empowering organizations to derive deeper insights from their data and make smarter, data-driven decisions.
- AI-Powered Analytics: Artificial intelligence and machine learning are playing an increasingly significant role in Power BI, enabling advanced analytics capabilities such as automated insights, anomaly detection, and natural language processing.
- Augmented Analytics: Augmented analytics tools are becoming more prevalent in Power BI, enhancing data discovery, visualization, and interpretation through features like smart data preparation, automated insights, and natural language querying.
- Predictive Modeling: Power BI is evolving to include more robust predictive modeling capabilities, enabling users to forecast trends and make informed decisions based on predictive analytics.
Conclusion
The Power BI financial dashboard is not just a tool; it’s a gateway to a new era of financial management. By utilizing the strength of Power BI’s advanced features, finance professionals can unlock the full potential of their financial data and make informed decisions that drive business growth. Whether it’s analyzing trends, forecasting future performance, or monitoring key metrics, Power BI provides the tools you need to stay ahead in today’s competitive landscape.
Sunflower Lab offers expert Power BI development services that can help organizations leverage Power BI’s capabilities to the fullest. Whether you’re looking to streamline your financial reporting processes or gain deeper insights into your financial data, our Power BI experts can help you achieve your goals.
Don’t miss out on the opportunity to revolutionize your financial management. Contact us today and discover how Power BI dashboard development can transform your organization’s financial performance.
Drive Success with Our Tech Expertise
Unlock the potential of your business with our range of tech solutions. From RPA to data analytics and AI/ML services, we offer tailored expertise to drive success. Explore innovation, optimize efficiency, and shape the future of your business. Connect with us today and take the first step towards transformative growth.
You might also like
Stay ahead in tech with Sunflower Lab’s curated blogs, sorted by technology type. From AI to Digital Products, explore cutting-edge developments in our insightful, categorized collection. Dive in and stay informed about the ever-evolving digital landscape with Sunflower Lab.