
Enabling Financial Leaders to Propel Success with Power BI Service
Why do people and leading companies across the industries continue to choose and utilize Power BI service for thier business intelligence? The answer lies within the global success due to its simplicity and data visualization capabilities which enhance the data analysis with a better presentation. Financial leaders always value thier time and with aspects like power BI desktop and app, they find it easier to access data and gain valuable insights within the existing data infrastructure. Enable Microsoft Power BI development services for the best BI strategy.
Understanding the critical components of these dashboards and the success stories supporting them is crucial for unlocking untapped potentials. As an industry executive, you are positioned at the forefront of innovation, harnessing the capabilities of Power BI dashboards to transform customer analytics, loan performance, financial operations, and regulatory compliance. Need to discover a one-shot to data success? Choose Power BI dashboard development with our experts.
What does the complete Gartner Magic Quadrant report say about Microsoft Power BI?
In 2023, Microsoft Power BI once again secured its position as a Leader in the Magic Quadrant for Analytics and Business Intelligence Platforms. This achievement continues its impressive streak, marking the 15th consecutive year as a Leader in the same quadrant in 2022.
The Gartner analysis highlights Microsoft Power BI service, part of the Microsoft 365 suite, for its data preparation, visual-based data discovery, and interactive dashboards. These features establish it as a top-tier platform for data analytics.
User reviews commend Microsoft Power BI as a robust data analytics platform with high scalability. Users particularly value its capability to extract and present data in a customized, user-friendly manner.
In a comparison with Tableau on Gartner Peer Insights, Microsoft Power BI stands out. While specific details of the comparison are not disclosed in the search results, both platforms have strengths and positive user feedback.
Moreover, the addition of enterprise reporting capabilities is identified as a target capability for Microsoft Power BI development, underscoring Microsoft’s dedication to continuous improvement and innovation.
Types of Power BI Banking Dashboards
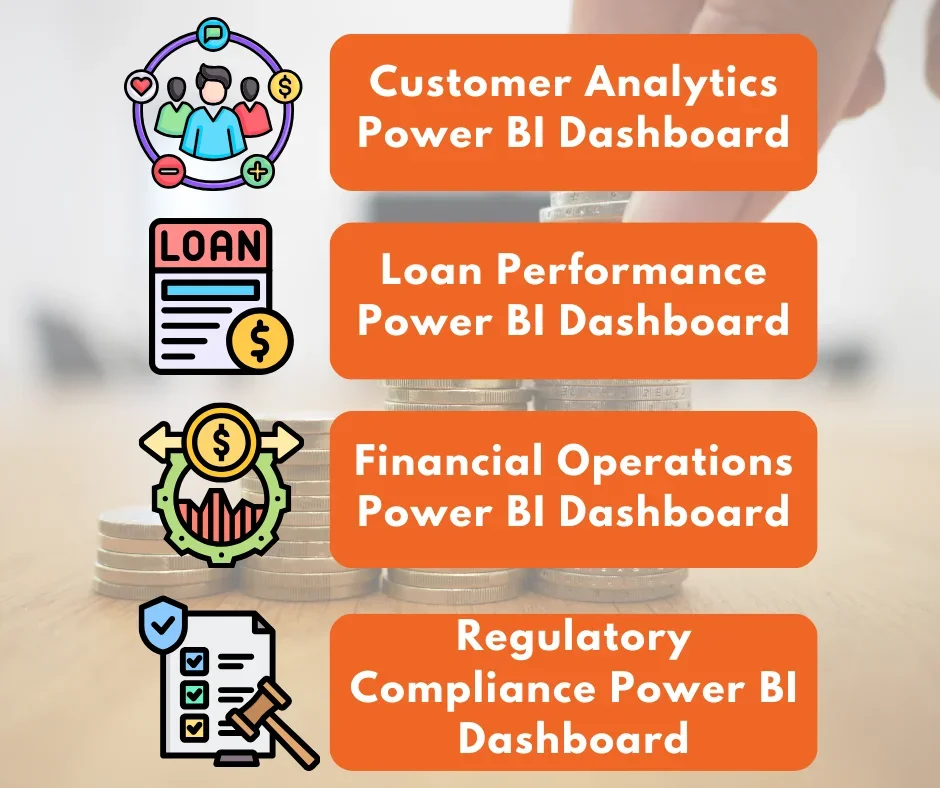
Customer Analytics Power BI Dashboard
The Customer Analytics Dashboard enables banks to gain deeper and actionable insights into their customers. Let’s delve into how this tool reveals valuable information and promotes a customer-centric approach.
Data Insights That Matter:
- Demographics: Age, income, location, and profession are key demographics captured by the dashboard. Analyzing these segments aids in tailoring products and services to specific customer needs.
- Account Activity: Transaction frequency, average balance, and types of transactions (deposits, withdrawals, transfers) offer a comprehensive view of how customers use their accounts.
- Product Usage: The dashboard monitors the products customers use (checking, savings, credit cards, loans) and their frequency, revealing customer preferences and identifying cross-selling opportunities.
- Spending Habits: Through transaction data analysis, the bank gains meaningful insights into customer spending patterns (e.g., categories, frequency), enabling targeted marketing campaigns and personalized financial advice.
Targeted Product Offerings:
- By leveraging customer demographics and account activity, the bank has the ability to tailor financial products to specific needs. For example, young professionals with substantial checking account balances may find high-yield savings accounts or investment options appealing.
- Examination of product usage can uncover gaps in customer offerings. If a notable customer segment underutilizes wealth management services despite having the financial capacity, the bank can introduce beginner-level investment products or educational materials.
Tailored Marketing Campaigns:
- By understanding customer demographics, spending habits, and product usage, the bank can personalize marketing campaigns. This can involve targeted email campaigns, social media advertising, or personalized in-branch recommendations.
- For example, if the dashboard reveals a customer is saving for a down payment on a house, the bank can promote mortgage products and financial planning services.
Improve Retention, Forget Churns:
- Customers with declining account activity or low product usage might be at risk of churning (leaving the bank for another institution). By identifying these customers through the Power BI dashboards, the bank can proactively intervene.
- This could involve offering incentives to retain them, such as fee waivers, personalized financial consultations, or exclusive product benefits.
One remarkable success story comes from Bank of New York Mellon Corp. leveraging Business Intelligence tools to enhance customer segmentation, leading to improved service targeting and higher customer satisfaction levels. This strategic data utilization sets industry standards (Source: Forbes)
Power Up Your Business Intelligence with Power BI
Turn complexity into clarity with our user-friendly Power BI solutions.
What does a Power BI Expert Do?
A Power BI expert excels in utilizing Microsoft’s Power BI platform to transform raw data into valuable insights to develop a impactful BI strategy, playing a crucial role in data-driven decision-making within organizations. Their primary responsibilities involve creating interactive dashboards and reports for stakeholders to easily grasp data. They possess expertise in understanding business intelligence needs, designing efficient data models, and providing accessible reports.
These professionals are renowned for their innovative visual data representations, showcasing not only technical proficiency but also strategic creativity. Their comprehensive knowledge covers a range of BI tools, from development to administration, ensuring the delivery of effective business intelligence services.
Loan Performance Power BI Dashboard
The Loan Performance Dashboard serves as a vital tool for banks, offering an insightful overview of their loan portfolio’s well-being. Let’s explore its features in more detail and understand its impact on daily operations:
Vital Metrics:
- Delinquency Rates: This metric gauges the proportion of borrowers falling behind on their loan repayments. The dashboard can display delinquency rates holistically, for specific loan categories (e.g., mortgages, auto loans), and across various timeframes (e.g., 30-day, 60-day delinquencies).
- Repayment Trends: Examining repayment patterns aids in evaluating the overall performance of loan products. The dashboard can illustrate trends such as average time to full repayment, prepayment rates, and balloon payment success rates.
- Loan-to-Deposit Ratio: This measure compares the total loans issued by the bank to the overall customer deposits. A high ratio signifies the bank’s heavy reliance on borrowing to support loans, potentially elevating risk.
How It Makes Risk Management Risk Free?
- Identifying early signs of rising delinquencies in a loan category empowers the bank to investigate the root causes. This may result from economic downturns, industry-specific challenges, or vulnerabilities in the loan approval process for that category.
- Analyzing repayment trends allows the bank to identify loan products or borrower segments historically linked to high delinquency rates. This facilitates the refinement of lending criteria for these categories, such as requiring higher credit scores or stricter income verification.
- Monitoring the loan-to-deposit ratio helps the bank manage liquidity risk. Excessive ratios could lead to challenges in covering loan repayments during deposit declines. Being vigilant about this metric enables the bank to attract more deposits or adjust its lending strategy.
Why It Improves Loan Approvals?
- Utilizing powerful insights from the Power BI solutions can refine loan approval criteria. For instance, if a particular segment of borrowers exhibits high delinquency rates, the bank can adjust credit score requirements or boost down payment percentages for that segment.
- Examining repayment trends aids in pinpointing loan products with consistently lower prepayment rates. This empowers the Power BI embedded bank to tailor loan terms (e.g., interest rates) to enhance the appeal of these products to borrowers, potentially bolstering profitability.
Smarter Resource Allocation For Loan Collection
- The dashboard excels in early identification of delinquent loans, enabling prompt collection actions by the bank data storage. This may entail sending reminder notices, engaging borrowers directly, or commencing restructuring discussions.
- Categorizing delinquencies by loan type empowers the bank to prioritize collection endeavors. For instance, resources could be directed towards recovering substantial delinquent mortgages before addressing minor auto loan delinquencies using Power BI.
By effectively utilizing the Power BI embedded Loan Performance Dashboard, banks can significantly enhance the health of their loan portfolio, reduce risks, and optimize lending practices with data analysis and data visualization. This leads to increased profitability, a more robust financial position, and ultimately, a more sustainable lending business.
Benefits of Data Analysis & Power BI in Banking
The banking sector plays a crucial role in the data revolution by managing large volumes of customer transaction data, regulatory requirements, and market trends. Data analysis and Microsoft Power BI development are key in this space, offering significant benefits to help banks tackle modern challenges and boost their competitive advantage.
Making Informed Decisions: In-depth data analysis gives banks valuable insights into customer behavior, market trends, and operational efficiency. Power BI turns these insights into easy-to-understand visuals, allowing executives to make quick, well-informed decisions.
Streamlining Operations: By automating data processing and reporting, Power BI cuts down on manual tasks and errors, enabling banks to optimize resource allocation for innovation and customer service.
Ensuring Compliance: With financial regulations getting stricter, Power BI aids banks in staying compliant. Real-time dashboards oversee financial operations, ensuring adherence to legal standards and enabling quick issue detection and resolution.
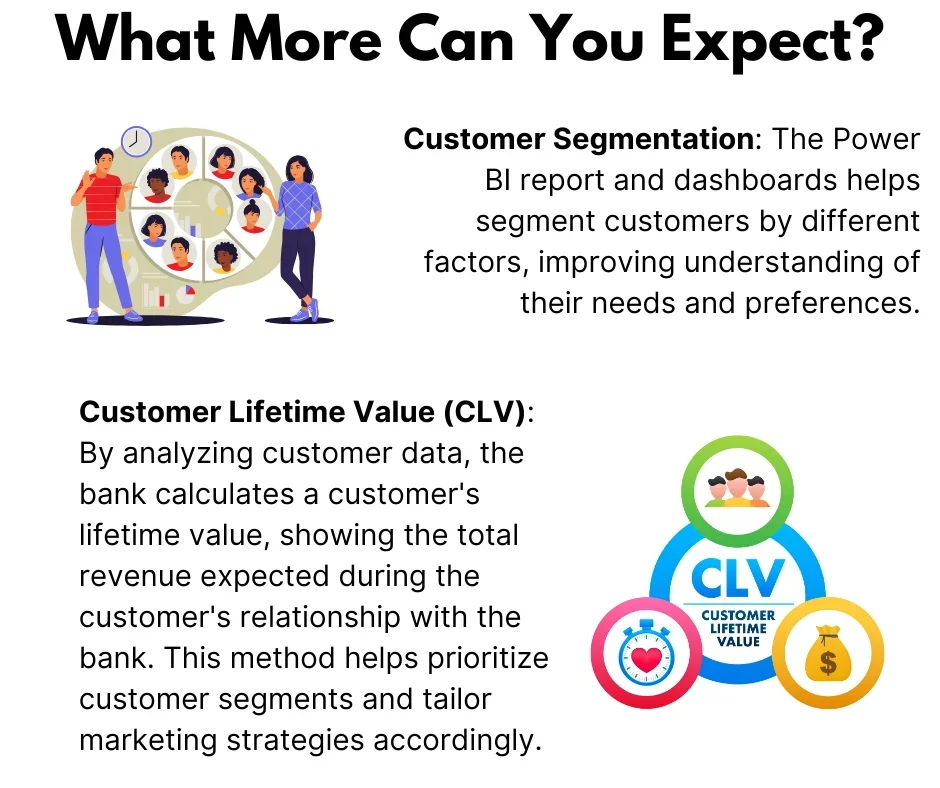
Enhancing Customer Understanding: Data analysis reveals customer preferences, helping banks offer personalized services. Power BI supports customer data segmentation, paving the way for tailored marketing strategies and product offerings to meet individual needs.
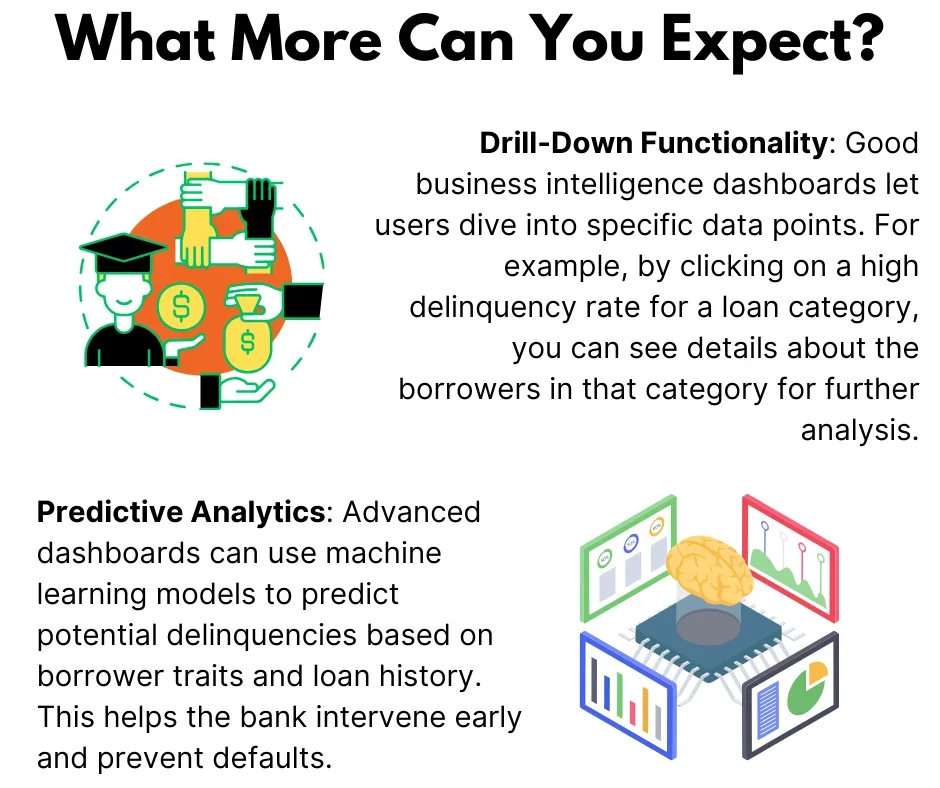
Strengthening Risk Management: Power BI’s predictive analytics assists banks in predicting and mitigating risks effectively. By analyzing historical data, banks can anticipate loan defaults, fraud attempts, and market changes, taking proactive measures to protect operations and customers.
In essence, integrating data analysis and Microsoft Power BI development in banking goes beyond operational improvements, promoting smarter decision-making, compliance, and customer interaction.
Financial Operations Power BI Dashboard
The Financial Operations Dashboard serves as the captain’s vantage point for monitoring a bank’s financial well-being. Let’s explore how it delivers real-time insights to enhance cash flow, strategize budgets, and pinpoint opportunities for cost savings.
Tracking The Essentials:
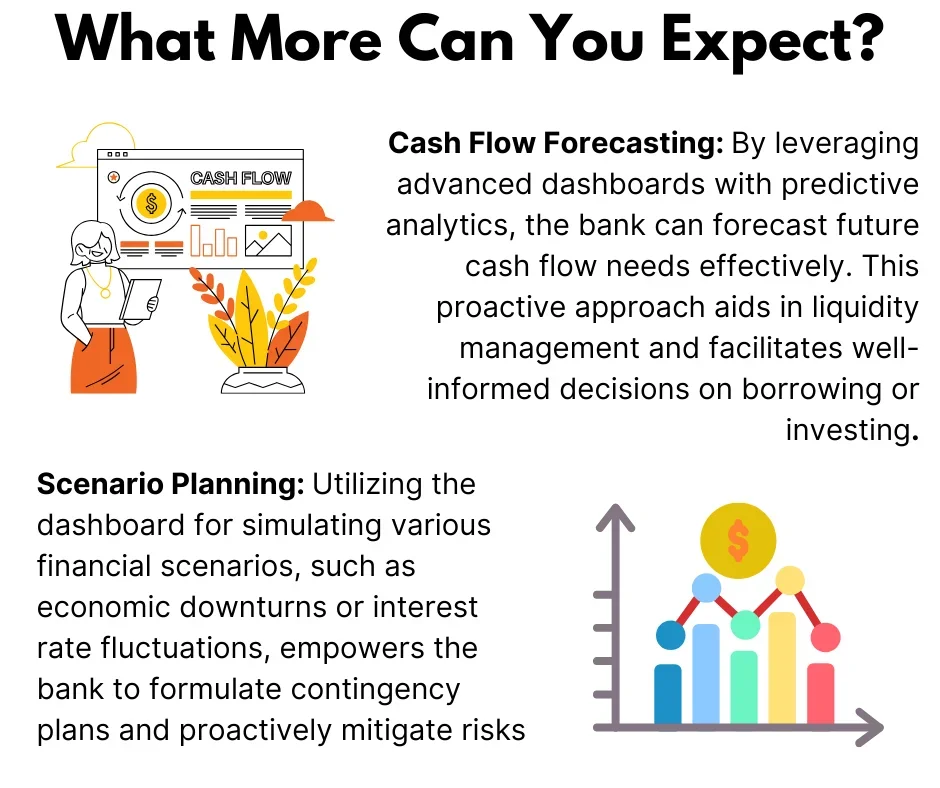
- Deposits & Withdrawals: These metrics offer real-time actionable insights into incoming and outgoing funds. Analyzing trends aids in forecasting future cash flow and spotting potential liquidity shortfalls.
- Transaction Volume: Tracking the quantity and types of transactions (deposits, withdrawals, transfers, payments) helps evaluate the bank’s operational efficiency and pinpoint areas for enhancement.
- Liquidity: This metric mirrors the bank’s capacity to meet short-term financial obligations. Monitoring liquidity guarantees sufficient funds to cover withdrawals and other commitments.
Manage Cash Flows With Ease
- By maintaining a clear overview of deposits and withdrawals, the bank can actively control its cash flow. For instance, if deposits consistently surpass withdrawals, the bank can invest surplus funds in interest-bearing assets to generate extra income.
- Examining transaction volume can aid in pinpointing peak transaction periods. Consequently, the bank can optimize staffing levels to ensure seamless operations and reduce customer wait times.
Budget Planning with Microsoft Power BI
- Utilizing powerful insights from the Power BI solutions can refine loan approval criteria. For instance, if a particular segment of borrowers exhibits high delinquency rates, the bank can adjust credit score requirements or boost down payment percentages for that segment.
- Examining repayment trends aids in pinpointing loan products with consistently lower prepayment rates. This empowers the Power BI embedded bank to tailor loan terms (e.g., interest rates) to enhance the appeal of these products to borrowers, potentially bolstering profitability.
Cost Reduction Tatics
- Power BI implementation can illuminate areas with high transaction processing costs, offering opportunities for streamlining processes and potentially automating tasks to reduce operational expenses.
- Analyzing deposit and withdrawal trends can pinpoint underperforming branches or services, enabling the bank to consider optimization strategies like branch consolidation or service restructuring, resulting in cost savings via Power BI capabilities.
By effectively using the Financial Operations Dashboard, banks can gain a deep understanding of their financial health. This helps make data-driven decisions, optimize resource allocation, and navigate the financial landscape with confidence. The outcome is improved financial performance and a stronger business model.
How Do I Create a Dashboard in Power BI?
Creating a dashboard in Power BI involves a set of steps designed to turn raw data into data visualization. Here’s an easier process to follow:
- Access Power BI: Log into your Power BI account. Sign up for a free version or choose a licensed option (Power BI Pro) for more features.
- Get Data: Import the data you want to analyze by clicking on the ‘Get Data’ button. Power BI supports various sources like Excel, SQL databases, and cloud services.
- Model Your Data: Use the Power BI desktop app to model your data. Set up relationships between data sets, and prepare your data with measures, dimensions, and calculations.
- Create Reports: Use the drag-and-drop interface to make visualizations such as charts, graphs, and maps. Highlight different insights on each page by adding multiple visuals to a report.
- Publish Your Report: Once your report is ready, publish it to the Power BI service for online access.
- Create a Dashboard: In the Power BI service, choose ‘Create a Dashboard.’ Name your dashboard, and pin visuals from your reports. Pin visuals from various reports onto a single dashboard.
- Customize & Share: Arrange and resize visuals, apply filters, and share the dashboard with other users in your organization for real-time insights based on the data.
Remember, successful Power BI dashboards not only needs to be created well but also needs to effectively convey insights in a clear way to your audience. Microsoft Power BI consulting services enables you to simplify this process further by letting a Power BI expert with a proven track record of several Power BI project do this for your organization.
Regulatory Compliance Power BI Dashboard
The dynamic realm of financial regulations presents a complex landscape for banks. Enter the Regulatory Compliance Dashboard, a vigilant watchtower ensuring compliance and mitigating risks. Discover how this tool empowers banks to navigate regulations, streamline operations, and optimize resources:
Regulatory Adherences
- The dashboard effectively monitors a wide range of pertinent financial regulations, encompassing Know Your Customer (KYC) protocols, Anti-Money Laundering (AML) rules, and capital adequacy requirements.
- Real-time updates are supplied on regulatory modifications to ensure the bank’s adherence to the most current standards.
Pinpointing Regulatory Risks
- Power BI solutions has the capability to analyze transaction data and customer profiles effectively pinpointing potential areas of non-compliance. This proactive strategy empowers the bank to promptly address and mitigate risks before they escalate into significant challenges.
- For instance, the business intelligence dashboard could detect a sudden increase in high-value transactions from a customer identified as high-risk. This detection prompts a thorough examination and potential addition of extra KYC or AML procedures.
Streamline Complaince Process
- Power BI capabilities enable automation of various compliance tasks, including data collection, report generation, and audit trail maintenance. By doing so, it decreases manual workload and liberates valuable staff resources.
- Moreover, it centralizes compliance documentation and policies, making them easily accessible to all relevant personnel, thereby ensuring uniform adherence to standards.
Real Time Success With Power BI Service: A Case Study
Company: Modular Assembly Innovations (MAI)
Industry: Manufacturing
Challenges:
- Modular Assembly Innovations operates multiple plants, each with its own data storage system and unique department access levels. The lack of a common folder structure causes challenges in data synchronization across the organization. Their ERP software, QAD 2010 SE, runs on an outdated OS, hindering integration with modern technology. Third-party tools are used for data retrieval and storage, with limited accessibility outside the internal network.
- Reports stored in Excel format are extracted in HTML, but heavy file sizes may lead to issues. The server’s age causes performance problems with QAD. Growing demands from accounting and finance departments require more data, causing slowdowns. Crashes result in production downtime for MP&L.
- At the project start, registering guest users outside the organization was a challenge. Initially used username/password registration, but failed as PowerApps only allowed Microsoft login. Access required PowerApps with Office 365 license.
What We Did:
- With PowerApps, viewing and modifying data becomes simpler. Data logs are carefully kept for easy organization and searching in SQL data. PowerApps improves user experience by offering a user interface to interact with data sources and get results quickly. Integrating databases with PowerApps goes beyond Excel capabilities in managing and visualizing data. This method allows smooth communication with data sources via a user-friendly interface.
- Users have the capability to retrieve data through prompts. The data was organized and made accessible via Microsoft Power BI. An application was developed in PowerApps, linked to the database. As a result, users could effortlessly access dependable reports on Microsoft Power BI Manufacturing dashboards, facilitating decision-making and strategic planning.
- Our solution involves issuing temporary licenses to guest users, enabling them to access the application with restricted features. Guest accounts are connected to Office 365 with a PowerApps license managed in Microsoft Azure, granting users access to PowerApps for data input and visual representation.
Want to Know The Detailed Success Story of How MAI Improved Data Accessibility And Integrity By Deploying The Database On Cloud For Reporting. Read Now
How much does it cost to hire a Microsoft Power BI specialist?
The costs of hiring a Microsoft Power BI expert or Power BI consulting service can vary based on factors like location, experience, and project complexity. Freelancers in the US may charge $70 to $150 per hour. Full-time salaries range from $70,000 to $120,000 yearly, depending on experience and location.
Companies should consider training, licensing, and system integration costs when hiring. Consulting firms specializing in Microsoft Power BI can offer cost-effective solutions with services like deployment and support. Assessing data needs and budget before choosing a hiring model is crucial. Hiring a skilled Power BI expert, whether freelance, full-time, or through a Power BI consulting services, can maximize the benefits of Microsoft Power BI tools for valuable insights.
Conclusion
In the finance industry, challenges come and go like the tide. As a banking executive, it’s key to stay practical yet forward-thinking with Power BI implementation. Microsoft Power BI dashboards are more than tools; they showcase a bank’s commitment to innovation, customer service, and operational excellence. They reflect the daring mindset of financial leaders reshaping banking standards.
Embrace the future of banking with Power BI dashboards. They’re not just for managing data but for improving your reality and shaping the future of banking. The stage is set for your success stories with Power BI. Contact Us Today
Drive Success with Our Tech Expertise
Unlock the potential of your business with our range of tech solutions. From RPA to data analytics and AI/ML services, we offer tailored expertise to drive success. Explore innovation, optimize efficiency, and shape the future of your business. Connect with us today and take the first step towards transformative growth.
You might also like
Stay ahead in tech with Sunflower Lab’s curated blogs, sorted by technology type. From AI to Digital Products, explore cutting-edge developments in our insightful, categorized collection. Dive in and stay informed about the ever-evolving digital landscape with Sunflower Lab.